Making cities wiser - Crowdsourcing for
better decisions
Maarit KAHILA and Anna BROBERG,
Finland


Maarit Kahila Anna Broberg
1)
This paper will be presented at the FIG Working Week 2017 in Helsinki, Finland, 29 May – 2 June.
The paper presents different innovative case studies from Finland and
abroad where Maptionnaire (a leading solution for collecting, analyzing
and discussing resident insight on a map) has been used. Based on the
findings a new public participation model has been drafted.
SUMMARY
The need in urban planning to make knowledge-driven decisions has
spurred the creation of new solutions to gather and utilize insight from
residents. Participatory planning has often been realized through
workshops and during face-to-face encounters, but little of the
knowledge gathered in these situations is of use in further urban
planning and city development. New technological innovations, such as
map-based public participation tools, support gathering information that
matters and makes cities wiser. Interaction with citizens not only
creates information, but supports also learning and innovation building,
and creates trusts.
Technological innovations like Maptionnaire help gather information
that makes cities wiser. Maptionnaire is a leading solution for
collecting, analyzing and discussing resident insight on a map. With the
help of Maptionnaire, various cities have been able to change their
modus operandi. Through these learning processes actors from different
sectors of the city are brought together to create joint understanding
of the possibilities of public participation. Cities have started to
value and use resident input as an equally important part of its
knowledge base for planning. There is a great potential for more
efficient use of participatory tools to make processes smoother and to
save money. Future development work is needed to further facilitate
knowledge transfer from residents to the use of planners and other city
officials.
In our presentation we will present different innovative case
studies from Finland and abroad where Maptionnaire has been used to
support two-way communication in different phases of planning processes.
Based on our findings we will draft a new public participation model
that assist the effective gathering of experiential knowledge from
inhabitants, provide high quality place-based data for various analysis
and informs participants about the stage and goals of the planning
process more innovatively.
INTRODUCTION
Urban planning is constantly seeking a balance between how to
develop and change existing living environments while maintaining their
valuable, existing character. This challenge has become acute in many
growing cities around the world, that share the same concern, how to
shape the existing city structure without reducing the very qualities of
the living environment people value most.
Cities are simultaneously becoming smarter in the ways they use
various sources of digital knowledge that aim to support their growth,
sustainability and usability. To plan cities wisely a broad group of
actors is needed. A central task of a planner is to construct linkages
between the differing actors of civic society and support them by
digital tools and processes. As such, the role of the urban planner in
the smart network society is turning into that of the facilitator who
understands the ongoing complex development patterns. Digitalisation can
enhance participation and integrate the differing voices of plural
society more efficiently. Traditional face-to-face participation methods
can be supplemented by tools utilizing social media and other
information and communication technologies (ICT) like web-based
geographic information systems (webGIS). The central question is not who
organises participation but how the different participation practices –
formal and informal - can be linked together and the information
produced adapted to the planning process.
The more democratic and efficient participatory planning processes
demand that we consider the opportunities for greater public
involvement. With the existing participation methods and procedures like
public hearings, workshops etc. a truly inclusive and effective public
involvement cannot be attained while these methods attract merely
participants that are able and used to express their opinions. Urban
planning practices should be more open to dissenting opinions expressed
by the general public. Though digitalization has brought many new and
inspiring tools to support more extensive participation, the utilisation
and usefulness of them need to be considered carefully in relation to
the specific planning process at hand.
One example of the ongoing digitalisation process emerging in the
participatory urban planning context is the set of webGIS tools such as
public participation GIS (PPGIS) methods. This article introduces one of
these tools, called Maptionnaire, that has been used in the field of
urban planning and that was originally developed in Aalto University in
Finland. We will introduce the tool, give examples of it’s usage in
various stages of the planning process and introduce a heuristic model -
participatory planning support system (PPSS) that emphasises the
usability and benefits of the PPGIS tools during different phases of the
planning process.
1. BACKGROUND OF THE PUBLIC PARTICIPATION GIS (PPGIS)
Researchers and practitioners from different backgrounds have
brought diverse vocabulary to the field of participatory GIS (e.g. Brown
& Kyttä 2014). Location based data collected from informal sources can
be divided roughly into Volunteer Geographic Information (VGI) and data
collected through Public Participation Geographic Information Systems
(PPGIS). VGI is data that is not solicited: it is provided by volunteers
spontaneously. Notable VGI projects include Wikimapia[1]
and OpenStreetMap[2]. In contrast, PPGIS data is
solicited from participants by a particular agency, for example during a
university research project or through participation in a planning
process.
Tulloch (2008) describes PPGIS as a field within geographic
information science that focuses on the ways in which the public uses
various forms of geospatial technologies to participate in different
processes. PPGIS also enables communication to take place on maps and
models in an intelligible visual form to those who have no expertise in
its technical basis (Carver, Evans, Kingston, & Turton, 2001).
Both PPGIS and VGI are related terms that define a process for
gathering and using non-expert spatial information (Brown & Kyttä,
2014). While PPGIS tools are often web-based, originating from the hands
of researchers, VGI tools are generally developed by lay people to
create, assemble, and disseminate voluntarily produced geographic data
(Goodchild, 2007; Hall, Chipeniuk, Feick, Leahy, & Deparday, 2010). VGI
has led to the ‘crowdsourcing’ of spatial information where the
user-generated content is produced by a large group of people through an
online community (Sui, Elwood, & Goodchild, 2012). Although joint
decision making can be understood as an object of crowdsourcing, many
VGI projects have nevertheless targeted rather on geographical
information gathering and visualization on certain topic. In both PPGIS
and VGI, the dimensions of purpose, geographic context, data quality,
sampling approaches, data collection, data ownership and dominant
mapping technology vary depending on the project (Brown & Kyttä, 2014).
Unlike in PPGIS projects the data validation through sampling has not
been in the core of VGI projects. Although both PPGIS and VGI tools can
be considered as tools that can promote data collection from a broad
group of people, this does not happen automatically. In many PPGIS
projects the reach has been quite limited serving only a small subset of
public (Schlossberg & Shuford, 2005).
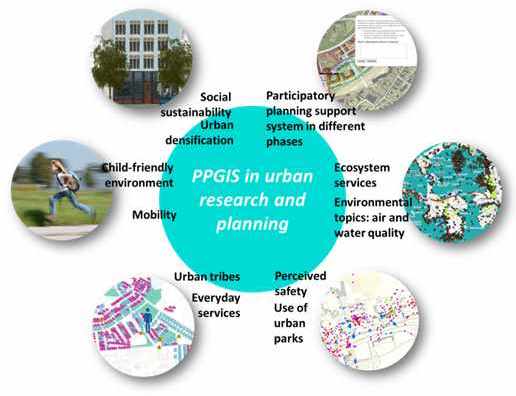
Figure 1: Some examples of PPGIS studies and planning practice
cases.
The SoftGIS methodology developed in Aalto University since 2005 is
an advanced example of PPGIS, which has been used already among over
30.000 Finns as well as in Japan, Australia, New Zealand, USA, Poland,
Portugal, Iran, Austria, Germany, Mexico and Brazil. SoftGIS is an
Internet-based public participation GIS (PPGIS) tool that allow the
locality-based study of human experiences and the transfer of this
knowledge into research and urban planning processes (Kahila & Kyttä
2009). Research themes studied with this methodology include for example
environmental childfriendliness, perceived urban safety and
accessibility of ecosystem services (see Figure 1). SoftGIS is grounded
in environmental psychology, but zooms closer into where exactly the
experiences take place [Kyttä, Broberg, & Kahila 2012].
SoftGIS
developed later to a commercialized Maptionnaire service that allow
anyone without any coding or GIS skills to create surveys and collect
and analyze data. The Maptionnaire tool will be introduced below.
2. INTRODUCING MAPTIONNAIRE – UNIQUE PPGIS TOOL FOR YOUR USE
Maptionnaire is a cloud service for creating and analysing map-based
questionnaires. Registering a test account and trying out the editor
tool is free of charge. Not long ago the creation and analysis of map
based questionnaires required considerable technological expertise.
However, with a commercial out-of-the-box cloud service Maptionnaire,
anyone can do a PPGIS study using no other tool than their web browser.
In addition to academic research, city planning departments,
consultancies and community engagement projects have been early adopters
of map based questionnaires. We believe that this is primarily because
there are higher-than-average amount of people with GIS expertise in
those fields. Location matters, whether you are studying suburban youth,
business travelling, real-estate management, infrastructure projects,
hiking in national parks, or shopping experiences.
2.1 Available maps
Maptionnaire includes a variety of maps. What base maps to use in a
questionnaire depends on the context. Often a survey needs to contain
more than one map allowing the respondent to choose the map layer of
choice. The map can represent
- the future, e.g. when asking opinions or ideas about alternative
town plans,
- the present, e.g. when studying the behaviour of people or their
mobility patterns, or
- the past, e.g. when collecting memories of elderly citizens.
Furthermore, the maps are not limited to the geography of large
areas. Small scale maps of indoor spaces such as schools, malls, or
airports make for interesting topics of research tool. Maptionnaire is
designed to work with essentially any digital map. This includes global
commercial providers like Bing, MapBox, and Google, as well as your own
WMS server that allows you to incorporate to Maptionnaire your own
map-files. In addition, if your map is a georeferenced image file but
you have no server of your own, it can be uploaded to our servers.
2.2.Types of map questions
Map questions can be constructed differently. Basically there are
two different approaches to asking questions on map:
- The respondent draws a point, line, or area on the map.
After drawing, she’s given a set of follow-up questions.
- The questionnaire itself includes interactive geometries on
the map. After clicking a geometry the respondent is given a set of
related questions.
Who is drawing on the map makes the fundamental
difference: either the creator or respondent of the questionnaire.
Maptionnaire supports both.
Let us take a map questionnaire focusing
on the housing preferences of urban dwellers and opinions about the
future development of a city as a simple running example in how to make
use of map in a survey and highlight the difference between the two
question types. In Figures 3 and 4 there are illustrations of both types
from the respondent’s point of view.
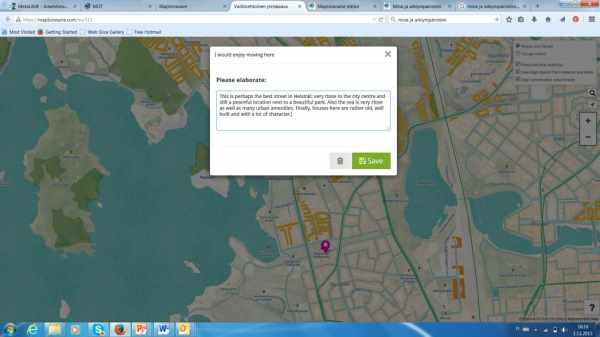
Figure 3 Placing a marker with
follow-up questions, respondent’s view.
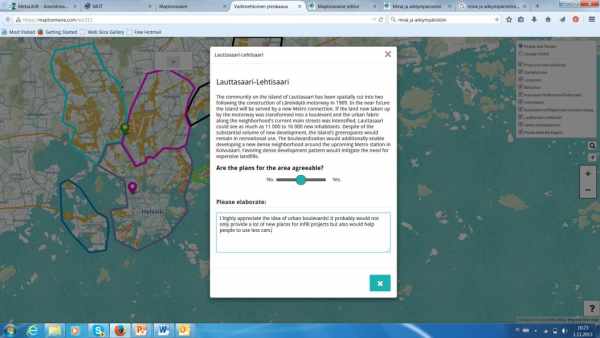
Figure 4 Choosing predefined
areas with follow-up questions, respondent’s view.
2.3. Output data
and analysis of map data
In comparison to traditional survey data
where the data comes in table format in Maptionnaire service the data
includes also geocoordinates of the responses. The two main benefits of
having answers with coordinates are:
- Precision and lack of
ambiguity. Almost any verbal description of a location, let alone that
of a route or area, is open to a lot of interpretation. In contrast,
modern web maps and satellite imagery allow zooming so close that a
dutiful respondent is able to pinpoint each individual tree in her
neighbourhood.
- Efficiency of analysis
and visualization. GIS tools let us spot patterns in large sets of
location based data and infer meaningful results. In addition, it is
considerably easier to communicate our findings to other people with map
visualizations.In Figure 5 there are two screen captures
from the analysis tool of Maptionnaire. Above we are looking at an
individual point of response data. The colors stand for different
questions, e.g. “Where is the happy place, shopping place etc”. Below
there’s a heatmap of the same points where we see the concentration of
points.
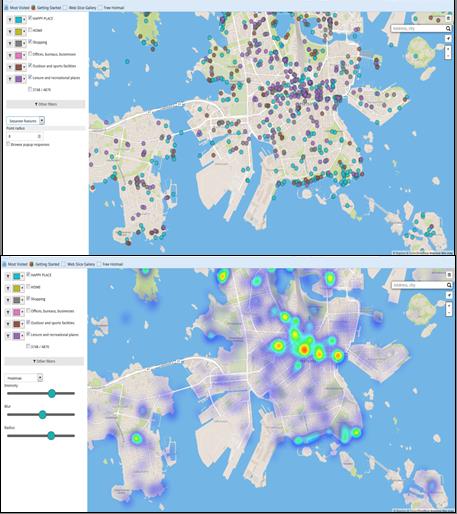
Figure 5 Maptionnaire analysis tool. Separate points (above) and
heatmap (below).
Often it is convenient to share the responses with the public, such
that the respondents don’t feel their effort is vanishing into archives
never to opened again. The map responses can be published in two ways:
Directly within the questionnaire such that while answering, the
respondent is able to see what others have already said. It is also
possible to comment other people’s answers. The analysis tool can be
made public, in which case anyone can have access to the filtering,
search, browsing, and visualization functions of Maptionnaire.
2.4 Integration with conventional questionnaire forms
Even though well-suited for
participatory projects, Maptionnaire has its roots in scientific
research. As a consequence, it comes with a full-blown questionnaire
tool set. Semantic differentials, likert questions, and multiple choice
questions are included and integrated with the location based data. They
allow for powerful quantitative analysis and classification.
Suppose,
for example, that a questionnaire
- asks the respondent’s age,
- has a drawbutton “Where do you go to relax?”,
- and the
drawbutton has a follow-up question “What do you find there?” with
options “Friends”, “Time alone”, “Sports”, and “Art”.
The analysis
tool can then filter the response data according to all these variables,
and for example visualize places where 50-59-year-old respondents go to
do sports with friends. Please feel free to explore the Maptionnaire
editor in http://maptionnaire.com/.
3. THE USE OF PPGIS THROUGH DIFFERENT PHASES OF THE PLANNING
PROCESS
The participatory planning support system (PPSS) is a conceptual
approach that can be used to support planning practices with a set of
participation tools and actions (Kahila-Tani 2016). It emphasizes
participation as a solid and continuous part of the planning and
decision making system. The focus is on different forms of knowledge, on
the adaptation of new tools and on clarifying the ways in which PPGIS
tools can be more profoundly embedded in the planning process. PPSS
system leans on the knowledge-informed planning approach. This means (1)
openness to different forms of knowledge; (2) acceptance of the
conflicting perspectives of actors; (3) integration of different
participatory tools and practices more profoundly into the planning
process; and (4) sensitivity to local practices and context.
The following sections explore in detail the different phases of the
planning process and clarify the role of participation in each phase. We
will especially look at the ways how PPGIS tools can support the
knowledge creation during the different phases and give examples how
Maptionnaire has been used. As identified earlier, the challenge is to
embed the concepts, ideas and tools in everyday practices. As such, the
aim is to narrow this gap by indicating the locus of webGIS innovations
throughout the planning process.
3.1. Early initiation
In the early initiation phase of a planning process, the selection
of current problems and issues should be better supported by the
participation process. Currently this seldom happens in urban planning.
The initiation phase should acknowledge the role of informal knowledge
creation through public discussions supported by digital tools but also
the role of the more formal knowledge that different studies can evoke.
As such, this phase can often blur into the evaluation phase (see
below). Currently, the role of participants is often minimal in the
early initiation phase. Both decision makers, planning authorities and
interest groups such as resident unions and even individual residents
could have a say and eventually affect the process of problem
recognition leading to the initiation of a new planning process.
Unfortunately, this kind of more extensive form of participation
highlighting the plural nature of values held across society, rarely
occurs.
Our observations have revealed that PPGIS tools can prove useful
during this phase. They can be used for systematic and broad data
collection that provide a basis for identifying problems that could be
addressed in a planning project or positive qualities that should be
protected. So far, there is limited evidence to show that the collected
data would have significantly impacted the agenda setting phase or led
to the initiation of other projects. Various VGI tools that aim to
crowdsource knowledge voluntarily or argumentation maps that support
capacity building and trust suit also to the initiation phase. Here, the
target is rather to collect ideas and initiatives than high quality
evidence. Again, it is easier to collect ideas than to find new ways to
link these individual or collective ideas into a more formal process
that could, eventually, lead to initiation. This demands more
transparency and intense communication between planners, decision makers
and residents.
Case
example - Designing a campus for cycling and walking
The real estate
company Aalto University Properties wanted to know how people move
around the Otaniemi campus — and where transit could be improved. The
aim is to create a user-friendly campus, where cycling and walking would
be as smooth as possible. With a map questionnaire respondents marked
their daily routes and most important places of students and employees
of the campus. Additional pop up questions were asked about how these
places are reached, and where new amenities are needed. The respondents
gave numerous suggestions. The comprehensive survey data will be used in
the long term development of the campus area and its services.
3.2 Initiation
In initiation phase the project has been formalized. The empirical
findings from our studies support the involvement of the participants
during the initiation phase. Residents can act as information producers
as well as react to suggestions from other respondents. This way the
versatile experiential landscape can be laid out that emphasises even
the controversial views. The data gathering and analysis via PPGIS and
VGA can be supported with face-to-face collaboration and communication
to validate and supplement the data gathering. This multi-stream model
of different methods confirms the initiation and demands a more thorough
participatory approach.
Though our cases prove that PPGIS tools are capable of supporting
the early stages of the planning process well there is also evidence to
suggest that even though planners value data collection the actual use
of the data after this phase has not been as effective as it could be. A
number of reasons for this have been identified: (1) planners still lack
the necessary skills to analyse the data, (2) planners are more
interested in legitimating the participatory process by arranging
possibilities for participation than in ensuring that the actual data
collected is used effectively and (3) those charged with the data
gathering task are usually not responsible for the actual plan making
and thus are not that interested in precisely how the data is utilised.
Case Example –
Thousands envisioned the Helsinki of the future
The city of Helsinki is drawing a new City plan, which will guide
the development of Finland’s capital until 2050. During the early phases
of the process city of Helsinki wanted to hear residents’ views with a
map-based questionnaire (Figure 6). Survey attracted almost 4000
respondents who made over 33 000 entries in the interactive city map.
The residents gave many suggestions for new building areas. They also
located urban nature spots they considered unique and worth protection.
“We got an excellent number of respondents and entries. The survey was a
success. Also, it was important for us to receive the analysis report
directly after the end of the survey, and the analysis tool for our
staff. I believe that the survey’s results will be used as a background
material for a wide range of future projects.” — Heikki Mäntymäki,
Communications Manager, City Planning Department
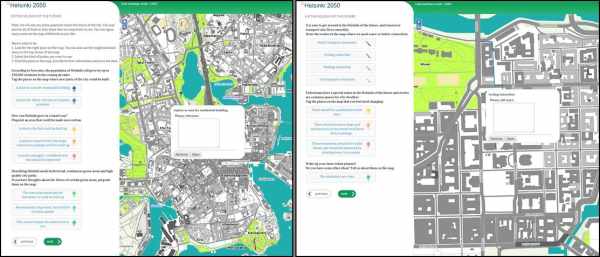
Figure 6 The Maptionnaire survey used in the
participatory process of Helsinki city plan 2050.
3.3 Formulation of alternatives
During the formulation of alternatives interaction between the
administrative level and the wider society often exists. Still, this
interaction is often organised through stable channels such as policy
networks. The formulation of the first drafts of the plan proposals is
normally, at least in Finland, held strictly among experts while lay
people are generally only able to comment on the proposals. Ideally, the
participants should be able to study and compare different alternatives
made by experts, affect the formulation of the alternatives and even
produce their own alternatives with the support of planners. Because
this planning phase concretizes the notions of a ‘good environment’ into
shaped plans that will then be negotiated and decided, inclusive
participation is essential to support the element of democracy.
In some of the completed PPGIS projects residents have been
allowed to evaluate different plan alternatives while the PPGIS allows
for a more dynamic visualisation of the plan proposals and enables
respondents to mark comments and opinions on a map. This phase could
become even more efficient if the alternatives outlined could support
transparency by highlighting how data collected previously have affected
plan proposals. This aim is, nevertheless, not simple to implement as it
is difficult to prove how such data has impacted the proposals.
Case
Example – Improving a national park with local insight
Finnish forestry organization Metsähallitus allowed the park users
to mark their favourite places (Figure 7). The majority thought that the
park needed both wild and recreational areas. The results influenced the
new maintenance and usage plan of the park, which separates the wild and
recreational areas. In addition, a PPGIS feedback service was designed
for alternative plans. The residents’ ideas and opinions were thus
included in the planning process on several stages.
“Maptionnaire is a
significant new service to complement the traditional hearing meetings.
It enables collecting opinions and wishes from wide stakeholder groups
and presenting them in graphic form. The data material is received in
GIS environment, which is a remarkable help. Therefore, it is ready to
use in map presentations and information systems.” — Senior Planning
Officer Arja Halinen, Metsähallitus
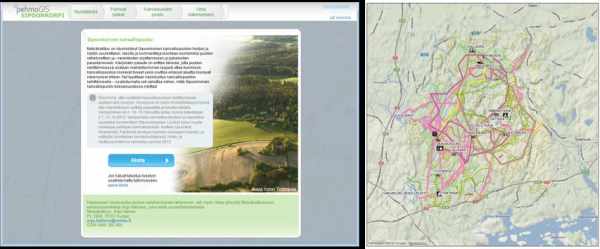
Figure 7 The survey used for
marking the favourite places and routes of park users (left) and the map
that summarizes the findings (right).
3.4 Decision making
The
final decision making phase remains in the realm of the responsible
institution where the decision is always preceded by a more or less
informal process of negotiated policy formation. This highlights the
importance of early stage participation in the planning process. Those
networks that shape the discussion are often long-established policy
networks with various interest groups. Whether existing policy networks
are really representative of a broad enough range of residents’ views
remains questionable.
Our observation indicate that only in a few of the projects
planners have been willing to use PPGIS tools during this phase. In
Finland, during this step all officially expressed opinions should
include personal data because planners are required to provide feedback
to every opinion. This procedure often delays the process as planners
can receive a significant number of opinions, each of which have to be
carefully studied. Understandably, planners are not eager to push the
use of the PPGIS tools during this phase as it would undoubtedly
increase still further the number of complaints. Experts are afraid of
information overflow where more information could lead to “further
confusion; obscuring, rather than clarifying the policy choices which
could otherwise be made more easily under conditions of relative
ignorance” (Young, Ashby, Boaz, & Grayson, 2002, 218).
3.5 Implementation
The implementation phase means the execution of the project through
the construction of the buildings, installing the infrastructure, or the
putting in place of some training or social programmes (Horelli, 2002).
The adoption of a programme does not guarantee that the action on the
ground will strictly follow policy makers’ aims and objectives.
Therefore participants should also be present during this phase, at
least through information. Empirical evidence does not, however,
currently support the use of PPGIS during this phase. Still, PPGIS would
be applicable to support the information process or perhaps to collect
feedback about the arrangements in the construction site.
3.6 Evaluation
The evaluation phase consists of
the assessment of the monitored data gathered throughout the project and
the evaluation of the changes in the physical and social structure.
Horelli (2002) emphasises an ongoing evaluation throughout the entire
planning cycle to better understand how participation has actually taken
place during the process. Thus, evaluation is not restricted only to a
particular stage in the policy cycle, but applied to the whole
policy-making process from different perspectives and different timing
(ex-ante, ex-post etc).
The research cases completed with the SoftGIS-tools support well the
ex-post evaluation which should play a more embedded practice in the
planning process. Evaluation could validate the effectiveness of public
participation by testing the generated quality of the process and the
quality of the received output and outcome. In reality, the actual
effectiveness of public participation remains hard to pinpoint as most
of the criteria discussed in literature are procedural rather than
substantive in that they relate to what makes for an effective process,
rather than how to measure effective outcomes ADDIN RW.CITE{{127
Rowe,Gene 2004}}(Rowe & Frewer, 2004). PPGIS tools offer a valuable way
to accomplish ex-ante or ex-post evaluation ADDIN RW.CITE{{63 Kyttä,M.
2012}}(Kyttä, 2012). The research cases concerning for example the
perceived quality of the living environment, environmental
childfriendliness or perceived safety can be viewed as ex-post/ex-ante
evaluation surveys. Here, the use of standardised queries would be
helpful to better enable comparison between data sets in different
places and cities.
Case example -
Academic research on recreational water use
The researchers of Aalto University wanted to examine the
recreational use and experimental value of the water areas of the
Helsinki metropolitan area. A map survey asked the respondents to locate
activity spots and landscape values near bodies of water. The survey
reached over 2000 respondents. The results proved that the citizens
enjoy spending time near water. The city shores are an important escape
from everyday life.
“Mapping out the versatile nature of the best loved
shores is a great opportunity — we can combine the big picture with
detailed local knowledge, and qualitative information with location
analysis, which leads to new interpretations.” – Researcher, Jenni
Kuoppa, Aalto University
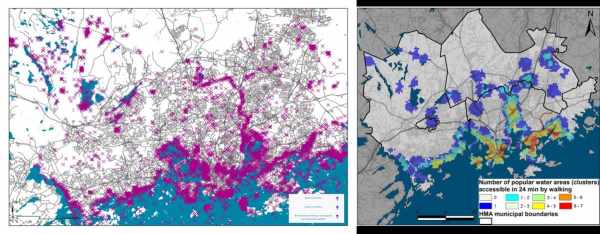
Figure 8 The activity spots by the water
identified by the respondents (left) and a map to show how many
important water areas are accessible by walking in different parts of
Helsinki metropolitan area.
3.7 Maintenance
The maintenance
phase means the transference of results and their nurturing into a
long-term perspective (Horelli, 2002). The residents’ role here can be
more passive turning them into commentators on the current state of the
environment. Regularly given feedback, such as e.g. Fix my street
-service, could have an important role in raising awareness of the
notifications made of the state of the living environment. Eventually
this or the former phase can feed into the understanding that connects
the process back to the problem definition stage completing the planning
process loop. The maintenance phase differs from the evaluation phase in
the way in which data is collected. In the evaluation phase it is
important to use random samples to validate the data while in the
maintenance phase data collection can occur on a more voluntary basis.
4. CONCLUSION
The aim of this paper was to introduce and go through the extensive
set of PPGIS practices studied in Finland and abroad by the SoftGIS team
in Aalto University. Long development work (2005-2015) of SoftGIS tools
and a commercialized service Maptionnaire have provided us insight how
research and urban planning practice can benefit of the use of these
tools. PPGIS tools are potential methods when a person needs to ask the
question “where”. It is powerful to allow local people to produce their
own maps expressing their personal experiences of their living
environment. Whereas in research this kind of data opens new
opportunities to study the person-environment fit in a novel way, in
urban planning the benefits are twofold. On one hand, planners embrace
this new information to support their knowledge-informed planning
practices. On the other, they can take the advantage of the tools as new
participatory mechanisms that consolidate the existing set of varying
participatory tools.
The Maptionnaire software and its multiple applications have
stimulated positive social change in the diverse fields of urban and
regional planning, environmental psychology, and natural resource
management, among others. How? The software was the first to
provide a user-friendly internet software platform allowing people to
identify and map their activities, experiences, values, preferences, and
other social attributes spatially, thus providing place-based data to
inform important social decisions about current and future land use. The
software also provides a platform for basic social research to better
understand how diverse populations, including children, interpret and
function in their physical environment. Historically, the “softGIS”
software contributed to what has been termed the “geospatial revolution”
over the last decade wherein the number of internet mapping software
applications has increased exponentially.
The empirical findings suggest that various PPGIS tools are
required to support different phases of the planning process and to
offer new ways to grasp residents’ views, experiences and opinions etc.
Further knowledge is, however, required from planning processes where
PPGIS tools are consistently used through different phases of the
project. It would also be interesting to study the data transformation
from raw data to planning proposals through the interpretation that
shapes the collective understanding.
To anchor the PPGIS tools and
location based user knowledge into the everyday routines of both the
residents and experts, not so many new tools and innovative concepts are
required. Rather, that challenge is to develop the existing planning
culture to become more open to versatile knowledge and to embed new
methods and ideas more profoundly into current practices. Our findings
highlight the important role played by the ‘super planners’ who are
willing to transform existing practices. As such, in order to overcome
these institutional barriers in the future we cannot continue to rest
alone on the shoulders of individual ‘super’ experts.
REFERENCES
Brown, G., & Kyttä, M. (2014). Key issues and
research priorities for public participation GIS (PPGIS): A synthesis
based on empirical research. Applied Geography, 46, 126-136.
Carver, S.,
Evans, A., Kingston, R., & Turton, I. (2001). Public participation, GIS,
and cyberdemocracy: Evaluating on-line spatial decision support systems.
Environment and Planning B, 28(6), 907-922.
Goodchild, M. F. (2007).
Citizens as sensors: The world of volunteered geography. GeoJournal,
69(4), 211-221.
Hall, G. B., Chipeniuk, R., Feick, R. D., Leahy, M. G.,
& Deparday, V. (2010). Community-based production of geographic
information using open source software and web 2.0. International
Journal of Geographical Information Science, 24(5), 761-781.
doi:10.1080/13658810903213288
Horelli, L. (2002). A methodology of
participatory planning. Handbook of Environmental Psychology, 607-628.
Kyttä, M. (2012). SoftGIS methods in planning evaluation. Evaluation for
Sustainability and Participation in Planning (pp. 334-353), Routledge.
Kyttä, M. Broberg, A. &
Kahila, M. (2012) Urban Structure Factors
Motivating Active Lifestyle among Children and Youth: A Case Study in
the City of Turku, Finland. American Journal of Health Promotion, Vol.
26, Number 5, e137 –e148.
Kahila, M. & Kyttä, M. (2009) SoftGIS as a
bridge builder in collaborative urban planning. In Geertman, S. &
Stillwell, J. (2009) eds. Planning Support Systems: Best Practices and
New Methods. Springer, pp. 389 – 411.
Kahila-Tani, M. (2016) Reshaping
the planning process using local experiences: Utilising PPGIS in
participatory urban planning. Aalto University publication series
DOCTORAL DISSERTATIONS, 223/2015
Rowe, G., & Frewer, L. J. (2004).
Evaluating public-participation exercises: A research agenda. Science,
Technology & Human Values, 29(4), 512-556. Schlossberg, M., & Shuford,
E. (2005). Delineating " public" and" participation" in PPGIS. URISA
Journal, 16(2), 15.
Sui, D., Elwood, S., & Goodchild, M. (2012).
Crowdsourcing geographic knowledge: Volunteered geographic information
(VGI) in theory and practice. Springer Science & Business Media.
Tulloch, D. L. (2008). Is VGI participation? From vernal pools to video
games. GeoJournal, 72(3-4), 161-171.
Young, K., Ashby, D., Boaz, A., & Grayson, L. (2002). Social science
and the evidence-based policy movement. Social Policy and Society,
1(03), 215-224.
CONTACTS
Maarit Kahila
Development director
Mapita Oy Kanavaranta 7 D 00160
Helsinki Finland
Tel. +358405626951
Email: maarit.kahila@mapita.fi
Web
site: https://maptionnaire.com/
|


