Article of the Month - June 2020
|
Innovative Approach for a Reliable Mapping of
the Morocco’s Solar Resource
Asmae Azzioui, Moulay Hafid Bouhamidi, Mustapha
Mouadine And Mohammed Ettarid, Morocco
 |
 |
 |
 |
| Asmae Azzioui |
Moulay Hafid Bouhamidi |
Mustapha Mouadine |
Mohammed Ettarid |
This article in .pdf-format
(16 pages)
This peer review paper should have been presented at
the FIG Working Week 2020, Amsterdam, Netherlands. The paper is about
how the current Moroccan energy policy aims to
develop and promote renewable and clean energy.This article
traces all the results of research and practical manipulations carried
out within this project.
SUMMARY
The current Moroccan energy policy aims to develop and promote
renewable and clean energy. To this end, one of the Morocco's most
available energies that could contribute appreciably to improving
national energy mix is solar energy. Thus, any solar project must rely
(at least in large part) on modeled (satellite-based) irradiance data.
However, a key question remains: the reliability of these data sets and
generated maps. Therefore, our study comes to highlight the problems
with the assessment of the solar resource and to stress the concept of
the calibration of satellite data (Meteosat) to ground measurements
(site-specific adaptation). In order to achieve this desired goal, we
have introduced the different procedures of local calibration used in
the solar energy industry and operated the calibration of the Moroccan
Solar Atlas (MSA). In this context, an innovative method of
generalization of the calibration to cover the entire territory of
Morocco has been implemented and has demonstrated the quality of the
proposed method and its contribution compared to conventional methods.
1. INTRODUCTION
Masen (The Moroccan Agency for Sustainable Energy) is responsible for
managing renewable energy in Morocco and leads development programs of
integrated projects aimed at creating an additional 3,000 MW of clean
electricity generation capacity by 2020 and a further 6,000 MW by
2030.The goal is to secure 52% of the country’s energy mix from
renewable sources by 2030. The site exploration direction is involved
early in the project development process, in order to identify the land
best suited to hosting energy complexes. It is responsible for assessing
the natural resources (implementation notably of the MSA) and all other
meteorological conditions (pressure, wind speed, temperature, rainfall
and humidity). Thus, the deployment of any solar technology begins with
the implementation of a solar information system that will allow access
to the dynamic values of the various components of solar radiation
called the solar atlas representing the mapping of the different
components of solar radiation. Solar parameters are GHI (Global
Horizontal Irradiance), DNI (Direct Normal Irradiance) and DHI (Diffuse
Horizontal Irradiance). The development of the solar atlas involves the
development of methods of treatment and analysis of different components
of solar radiation from satellite data (reflectance). However, satellite
imagery tends to underestimate or overestimate the values of solar
irradiance (GeoModel Solar, 2013). The result is the need to calibrate
these data and adapt them to the ground values based on in-situ
measurements acquired by seven kingdom-wide stations (Boujdour,
Laayoune, Tata, Midelt, Ouarzazate, Taznakht and Ain Beni Mathar), since
local ground data acquired by ground-based measuring instruments are
much more accurate than satellite models (2% versus 5-15%). This local
adaptation procedure is thus essential to obtain the best possible solar
resource data.
This paper traces all the results of research and practical
manipulations carried out within this project. The first part is devoted
to the presentation of the state of art of the main methods used in the
local calibration of satellite data. This review is based on application
examples found in articles and publications and on formalizations
corresponding to different domains (the wind industry). From this study,
the methods that will be applied to MSA will emerge. Thus a second axis
will expose all the practical manipulations as well as the presentation
and the analysis of the results. From these conclusions, we will see
what perspectives are envisaged and their interest and importance for
the continuation and improvement of the results of this project.
2. BIBLIOGRAPHICAL REVUE OF ON-SITE ADAPTATION APPROACHES
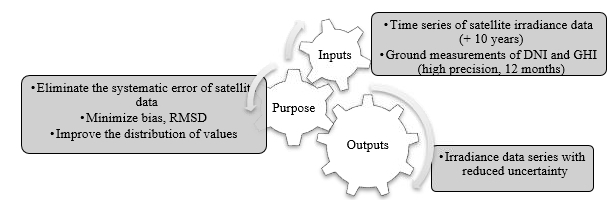
2.1 Definition
The calibration consists of adjusting a "time series" of long-term
spatial modeled long-term irradiation satellite data, to time series of
punctual accurate and high-quality short-term in-situ measurements
through the determination of a set of parameters and calibration
coefficients. Local correlations and adaptations of modeled irradiances
should only be applied under the following conditions (Badger et al.,
2012):
- Systematic deviation (bias) or systematic mismatch of frequency
distributions
- Constant amplitude of the deviation, or seasonal periodicity
- In situ measurement of good quality spanning a period of 2
years, minimum 12 months. A shorter period (6 months) is possible in
order to best cover the seasonal effects (Šúri et al., 2011)
- Modeled satellite data: time series representing more than 10
years of data should be used
2.2 Classification of site-adaptation methods
The different procedures could be classified in 3 groups, according
to the approach used to treat the calibration process, as follows:
1. Statistical approach of adaptation applied to previously derived
GHI and DNI (Fig. 1). Two variants of this approach had been presented,
namely the quotient (Gueymard et Wilcox 2009) and the regression of the
cumulative frequencies (Meyer et al. (2012).
2. Physical Approach: Adaptation approach of input data of the
satellite model with re-application of the model on the satellite images
to eliminate the systematic errors. Wey et al. (2012).
If we want to compare the two previous approaches (Fig. 2), we can
say that the first one is
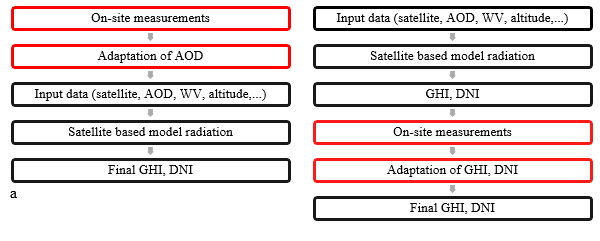
downstream correction of the irradiations while the second is an
upstream adaptation of the input data of the satellite model
Figure 2. Comparison between the physical (left) and statistical
approach (right)
3. Statistical approach based on advanced techniques commonly used in
numerical weather prediction methods NWP, such as
Measure-Correlate-Predict (MCP) Stoffel et al. (2010), and Model Output
Statistics (MOS) Thuman et al. (2012), (Bender et al., 2011).
2.2.1 The Quotient Method
This method is based on the calculation of the quotient between the
modeled and measured values for the common period. This ratio is
calculated on a monthly basis and is considered constant throughout the
month in question and applied systematically every hour (or even hourly
subintervals) during that month (Leloux et al., 2014):

m is the month of the year from 1 to 12, DNIm, MEAS is the monthly
value of the DNI measured by the in situ radiometer, DNIm, DB is the
corresponding modeled value provided by the database and δm is the bias
between the measured data and the modeled data. The estimated biases are
then applied to correct the long-term data:

DNIm, LT, DB is the long-term value of DNI contained in the database
and DNIm, LT, ε is the corresponding value corrected by the present
method
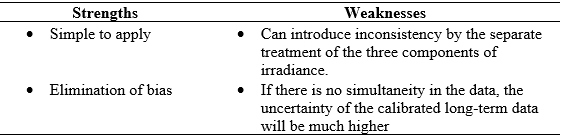
TABLE 1. Strengths and
weaknesses of the quotient’s method
2.2.2 Regression of Cumulative Frequencies "Feature transformation"
In this method and for the whole common period, the measured
frequency distributions are evaluated and considered as reference (Fig.
3), on which are then adapted those of modeled irradiances. (Sùri et
al., 2010)
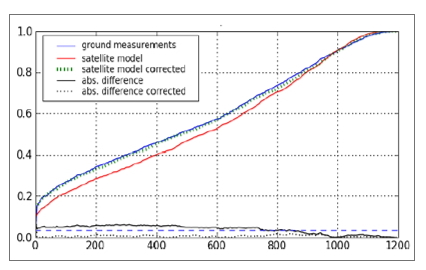
Figure 3. Comparison between
the physical (left) and statistical approach (right)
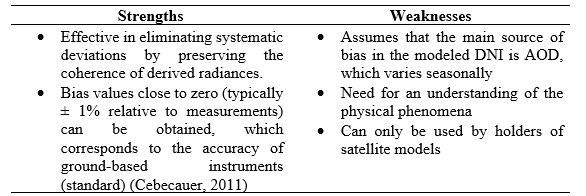
TABLE 2. Strengths and
weaknesses of the feature transformation approach
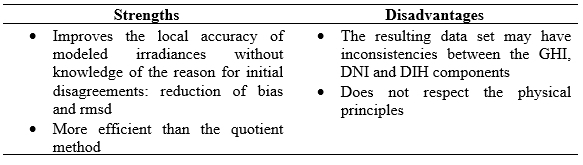
2.2.3 Adaptation of Input Data of the Satellite Model
This is in fact an approach quite similar to the previous method
because it tends to reduce the main statistics (bias, RMSD and KSI), but
the adaptation is done here at the level of the input data Wey et al.
(2012). For our case, since we have neither physical models nor their
input data, we cannot apply the method of adaptation of input data.
TABLE 3. Strengths and
weaknesses of the physical approach
2.2.4 Weighted Average Method or Method of Combining Satellite Data
and Ground Measurements
The idea is to calculate a weighted average of all input data (in
situ measurements and modeled satellite data) over a certain parallel
period (Meyer et al., 2008). This average is considered the best
estimate of the input datasets. Since the high accuracy of the in situ
data will be transferred to the time series of the satellite. It can be
calculated by formula 3:

We take the inverse of the uncertainty of the measurement δ of each
set of data j as a weight, where j is a set of individual data for a
particular site, and n is the total number of independent datasets. This
approach combines proportionally with the quality expressed by the
uncertainty δj, the n data sets. Once the average is calculated, it is
necessary to identify the relationship between the adjusted data and the
raw satellite data to apply it to the values of the raw satellite
history.
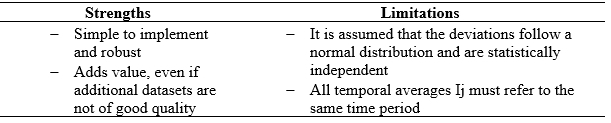
TABLE 4. Strengths and
limitations of the weighted average method
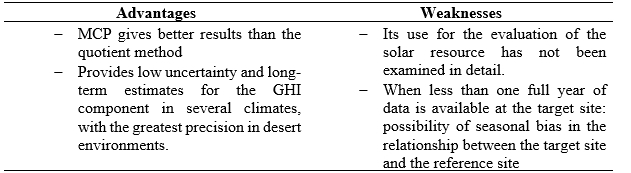
2.2.5 MCP Approach (Measure-Correlate-Predict)
This method is more suited to wind than solar. It is based on a
variety of statistical methods in which in situ (short-term)
measurements at a new site (plant location) are linked to long-term
measurements at a nearby reference site to obtain long-term estimates of
the energy potential at the new site and the interannual variability
(Fig. 1). In other words, the correlation is used to predict the
resources for the new site. (Thøgersen et al., 2007).
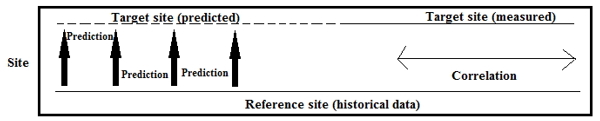
Time
Figure 4. Principle of the MCP
method in the wind industry
There are three types of methods (MCP), the aim is to find an
equation that passes through each of the measurement points and use it
to correct or interpret all the other measurements (JV Nicholas and DR
White, 2001): the ratio of variance, Mortimer, and artificial neural
networks (Sheppard, 2009). Of these three methodologies, only the ratio
of variance is recommended for general use and only for datasets with a
correlation coefficient greater than 0.8 (Sheppard, 2009). The latter
was developed by Rogers et al. (2005a), in response to the
aforementioned failure of linear regression. It consists in forcing the
variance of the predicted irradiance at the target site to be equal to
the variance measured at the target site. The predictor equation for the
Ratio of Variance is as follows (Sheppard, 2009):

where x is the historical irradiance at the reference site, sx and sy
are the standard deviations of the irradiance sample measured at the
reference and target sites, respectively; and are the average of the
irradiance sample at the reference and target sites, and is the
predicted irradiance at the target site. As part of this study, we tried
to adapt this model to the solar context while respecting its principle
and its objective. One calculate for equation 4 (for each month and for
each station) its parameters (the coefficient: first term of the
equation and the constant: the second term of the equation) using the
data of the common period in order to define the ratio of the variance
model which will be applied to the monthly values of the satellite
history.

Taking x is the monthly satellite irradiance of the uncalibrated
history, sx and sy are respectively the standard deviations based on the
daily values of the satellite irradiance and measured on site, and are
respectively the monthly average calculated from the daily values of
satellite irradiances and measured on site, and is the monthly
satellite irradiance of the calibrated history. It should be noted that
the constant term must be multiplied by the number n of days per month
because it is calculated on a daily basis.
TABLE 5. Advantages and
weaknesses of the MCP method
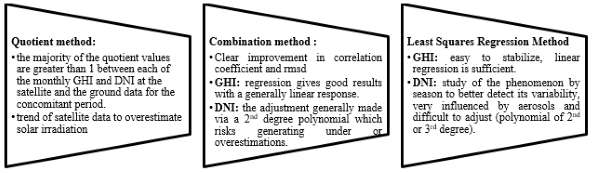
2.3 Discussion
For our case study, we chose to initially apply a method simple to
implement in order to easily calibrate the solar atlas and thus have
preliminary conclusions. Thus, the method chosen, in view of its
simplicity, is the quotient. Moreover, given the robustness of the ratio
of variance method, which is one of the variants of the MCP approach, we
have chosen, secondly, to apply it as well and to adapt it to the solar
context. In order to add value to the work and to enrich the research in
this modestly explored calibration field, we adopted two other methods
(combination, regression by least squares) especially that it is an area
still fertile with not enough references dealing with the theme.
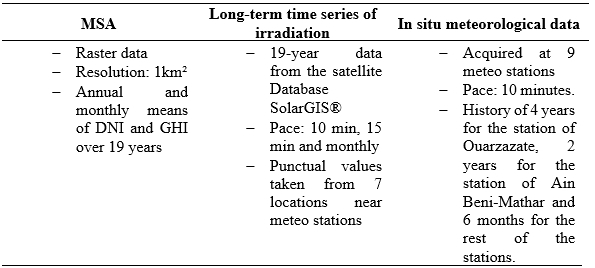
3. Data
The data was provided by Masen (confidential data and property of
Masen), (Table 6):
TABLE 6. Description of used
datasets
4. Methodology
The calibration process of the MSA can be summarized in 6 main steps
namely (Fig.5):
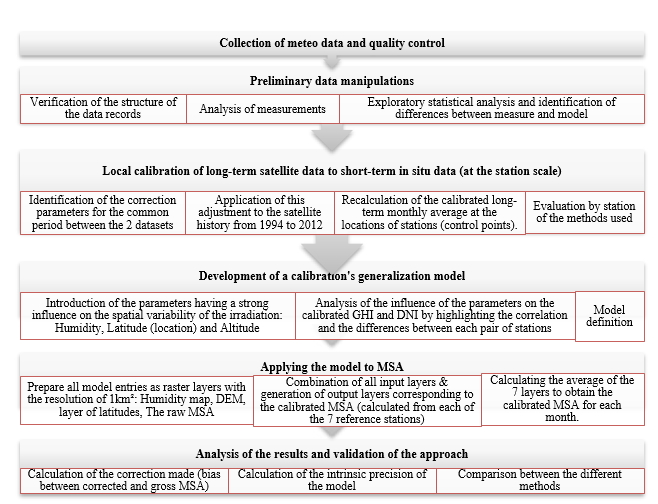
Figure 5. MSA calibration
procedure
We have developed a model of the generalization
of the calibration which takes into consideration certain physical
parameters having a very palpable effect on the spatial variations of
irradiation to ensure a certain robustness of the approach namely:
- Humidity ∆hum
- Latitude (location) ∆φ
- Altitude ∆h

5. Results and discussion
5.1 Preliminary Manipulations
One note that the satellite database produces highly correlated GHI
and DNI estimates with in-situ measurements but is usually
systematically overvalued with degraded quality for stations in
mountainous, humid and high aerosol concentration areas. The overall
discrepancies hide a great variability of satellite estimation
performance, both spatial and temporal. On the other hand, although
overall concordance is good, seasonal variations exist and require a
seasonal approach of calibration.
5.2 Local Calibration of Satellite Data to Ground Measurement
5.2.1 Results of Adaptation for the Common Period
Through the results presented in these graphs (fig. 6), we clearly
notice the contribution of the calibration of satellite measurements to
the ground for the simultaneous period of data sets.
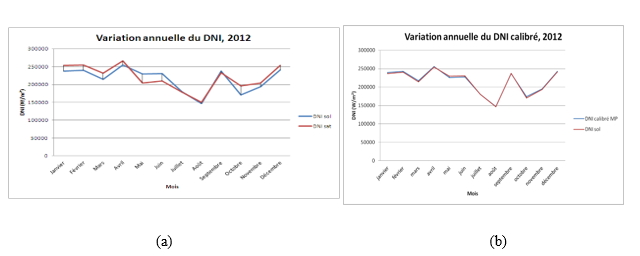
Figure 6. Comparison between
monthly irradiances before (a) and after (b) calibration with in situ
measurements for the 2012 common period (case of Ouarzazate station)
5.2.2 Results of the Calibration of the Historical Data
We notice after the analysis of the results that
the ratio of the variance and quotient methods have the lowest rmsd;
this corroborates their strong intrinsic precision. Moreover, the
corrections made by these two approaches vary in the same direction.
Moreover, following the application of the calibration coefficients of
each of the regression methods and the weighted average to the
historical values, we obtain some outliers and physically impossible DNI
values for some stations. This proves that the model based on only one
year of concomitant or less measurements does not represent the large
year-to-year variations of the DNI over a period of 19 years. We have
therefore decided to eliminate the methods of regression and weighted
average. We also note a very significant degradation of the performance
of the calibration of the DNI component compared to that, excellent of
the GHI. As a result, we have chosen to generalize at the MSA scale the
ratio of variance method with respect to its robustness, performance and
essentially because it retains the mean and standard deviation
(dispersion) for the common period. We used the quotient method to have
a comparison item.
5.3 Development of a Global Calibration Model
After calculating the coefficients of the model,
we find that the latitude and the humidity are the parameters having a
strong influence and a significant weight on the variations of
irradiance, in counterpart the effect of the altitude is relatively weak
because at the satellite data used have undergone altitude and shadow
effects corrections. Following the calculation of the
variance-covariance matrix of the model parameters for the ratio of
variance and quotient method, we note that the correlation coefficients
between the parameters are very negligible. Therefore, their
significance cannot be to be questioned. Moreover, the accuracy of
determining the coefficients of the model is high. This attests to the
quality of the adjustment by least squares.
5.4 Validation of the Calibration Model
The accuracies provided by the calibration
methods applied are very satisfactory and quite equivalent with higher
performances for the hot and sunny months of the year (june, july, and
august). It is around 0.6% for the GHI and 0.5% for the DNI. We note
that for the ratio of variance method, the made corrections are negative
for cold months and positive for warm months. This can be explained by
the fact that the satellites underestimate irradiance for cold months as
clouds reflect irradiation, and overestimate it for warmer months, hence
the systematism is not constant and therefore it is compensated. Also,
the negative annual correction (almost 90% of the annual irradiance
corrections are centered between -13.3% and 2.5% for the DNI) reflects
exactly the situation of the MSA which tends to overestimate the
irradiance actually received on the surface. We also note that the
corrections made to the month of January and December are the most
important: these months are the only ones to deviate from the rest of
the year for the Moroccan winter climate. For the quotient method, we
note the existence of a positive bias (the correction is always
positive) and homogeneous with the exception of December. However, this
finding does not reflect exactly the reality because satellite models
sometimes overestimate irradiance and sometimes underestimate it.
Based on this analysis, we recommended the
adoption of the ratio of variance method for MSA calibration. Figure
7shows maps that clearly reflect the results of the ratio of variance
method. One notes that the accuracy of the calibration (rmsd which is
the intrinsic accuracy of the model, calculated from the 7 individual
calibrated values from each station and their average) for the DNI is
generally lower in coastal areas (pronounced impact of humidity on the
decrease of the DNI). On the other hand, the made correction depends on
the concerned geographical position: positive and decreases until it
becomes negative while moving towards the south and the north. Overall
the MSA has undergone a correction of 0.9% for the GHI and -6.6% for the
DNI.
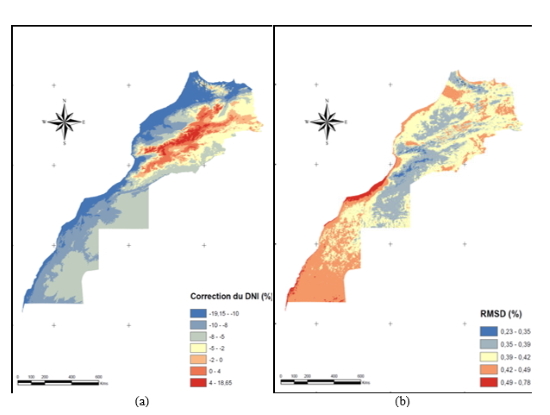
Figure 7. Correction to the
annual DNI (a) Accuracy of the calibration of the solar atlas of the DNI
in July (b)
6. Conclusion and Perspectives
In fact, in-depth resource evaluation leads to more accurate energy
estimates, detailed resource analysis, and better characterization of
the project site, thereby reducing project-related risks. Hence the
importance of the ground-based calibration of the MSA. This work was
therefore initiated by the desire to obtain solar atlases that
correspond well to local conditions in Morocco and further improve their
reliability. Thus this study represents only the beginning of a
reflection which must be deepened and widened to improve the Moroccan
Solar Atlas and its reliability. We recommend to continue this
reflection and to:
- Proceed for the calibration of the MSA according to two
approaches: Direct method: calibrate with respect to the ground
(This is the approach applied for this study), and Indirect method:
calibrate against the TMY (typical meteorological year) as a source
of comparison and validation of the first approach.
- Automate the calibration process and continue the measurement to
further confirm the results of this study and establish a dense
network of stations
- Generate the calibrated output raster layer by calculating the
weighted average of the 7 determinations by the inverse of the
distance between the pixel and each of the 7 stations (for our case
we have calculated a simple mean).
Acknowledgments
This project is part of Masen's efforts to develop scientific skills
by launching the "The Graduation Projects of Excellence" initiative. The
idea behind this initiative was to select students on criteria of
academic excellence, in partnership with universities and national
schools, in order to carry out end-of-studies projects in partner
companies. The objective is to constitute a first pool of skills, able
to participate in the development of the solar sector in Morocco.
Therefore, I would like to thank Masen for both the subject's proposal,
the financial support for this work, and for the provision of solar
irradiation data. The scientific supervision of the project was provided
by Pr. M. ETTARID and Mr. M. H. BOUHAMIDI. May they find here the
expression of my sincere gratitude for providing valuable insights and
facilitating the project progress. I also express my warm thanks to Pr.
Adel Bouajaj, Research Professor at The National School of Applied
Sciences (Tangier), Pr. Hans-Georg Beyer from University of Agder
(Norway), Pr. C. Gueymard, President of Solar Consulting Services (USA)
and Mrs. J. Carow, Renewable Energy Engineer at Nordhausen University
(Germany) for guiding me towards the richest bibliography.
REFERENCES
- C. A. Gueymard and S. M. Wilcox, Spatial and temporal
variability in the solar resource: assessing the value of short-term
measurements at potential solar power plant sites. Solar Conf.,
Buffalo, NY, American Solar Energy Soc (2009).
- R. Meyer, K. Chhatbar, M. Schwandt, Solar resource assessment at
MNRE site in Rajasthan, Technical Report, Suntrace (November 2012).
- E. Wey, C. Thomas, P. Blanc, B. Espinar, M. Mouadine, M. H.
Bouhamidi, Y. Belkabir, A fusion method for creating sub-hourly
DNI-based TMY from long-term satellite-based and short-term ground
based irradiation data. Proc.SolarPACES 2012. Conf., Marrakech,
Maroc (2012).
- T. Stoffel, D. Renné, D. Myers, S. Wilcox, M. Sengupta, R.
George, C. Truchi, CSP: Best Practices Handbook for the Collection
and Use of Solar Resource Data. Technical Report, NREL/TP-550-47465,
National Renewable Energy Lab., Golden, CO (2010).
- C. Thuman, M. Schnitzer, P. Johnson, Quantifying the accuracy of
the use of MCP methodology for long-term solar resource estimates.
Proc. World Renewable Energy Forum, ASES, Denver, CO (2012).
- G. Bender, F. Davidson, S. Eichelberger, C. A. Gueymard, The
road to bankability: improving assessments for more accurate
financial planning. Solar Conf., Raleigh, NC, American Solar Energy
Soc. May 2011.
- J. Badger, F. Kamissoko, M. O. Rasmussen, S. Larsen, N. Guidon,
L. B. Hansen, L. Dewilde, M. I. Alhousseini, P. Nørgaard, I.
Nygaard, Estimation des ressources éoliennes et solaires au Mali,
Faisabilité des ressources d'énergies renouvelables au Mali (2012).
- M. Šúri, T. Cebecauer, Requirements and standards for bankable
DNI data products in CSP projects, Proceedings of the SolarPACES
Conference, Granada, Spain (20-23 Sept 2011).
- J. Leloux, E. Lorenzo, B. García-Domingo, J. Aguilera, C. A.
Gueymard, A bankable method of assessing the performance of a CPV
plant Applied Energy, Elsevier (2014).
- M. Šúri, T. Cebecauer, R. Perez, Quality procedures of solargis
for provision site specific solar resource information, Proc.
SolarPACES Conf, Perpignan, France (2010).
- R. Meyer, J. T. Butron., G. Marquardt, M. Schwandt, N. Geuder,
C. Hoyer-Klick, E. Lorenz, A. Hammer, Combining Solar Irradiance
Measurements and Various Satellite-Derived Products to a
Site-Specific Best Estimate, Solar PACES Symposium, Las Vegas, USA
(2008).
- T. Cebecauer, R. Perez, M. Suri, Comparing performance of
SolarGIS and SUNY satellite models using monthly and daily aerosol
data, Proceedings of the ISES Solar World Congress 2 (28 August –2
September 2011, Kassel, Germany).
- G. Bender, F. Davidson, S. Eichelberger, C. A. Gueymard, The
road to bankability: improving assessments for more accurate
financial planning. Solar Conf., Raleigh, NC, American Solar Energy
Soc. (May 2011).
- M.L. Thøgersen, P. Nielsen, T. Sørensen, An Introduction to the
MCP Facilities in WindPRO, Aalborg Ø: EMD International A/S (2007).
- J. V. Nicholas, D. R. White, Traceable Temperatures, An
Introduction to Temperature Measurement and Calibration, Second
Edition (2001).
- C. J. R. Sheppard, Analysis of the Measure-Correlate-Predict
methodology for wind resource assessment. HUMBOLDT STATE University
(2009).
- GeoModel Solar: Suri M., Cebecauer T., Gueymard C. A., Ineichen
P., 2013. "Evaluation de la ressource solaire dans le cadre de la
qualification des sites pour le développement de projets solaires :
Meilleures approches disponibles pour l’évaluation de la ressource
solaire et de sa modélisation"
BIOGRAPHICAL NOTES
I am Asmae Azzioui a Moroccan young surveyor engineer. I graduated
from the Geomatics and Surveying Engineering School by 2014 in Rabat
(Morocco) and have the pleasure to benefit from the FIG Foundation
fellowship to attend and participate in the FIG congress in Malaysia
held at the same year. I am working at Masen (Moroccan Agency for
Sustainable energy) as a sites exploration engineer in charge of
prospecting the most suitable places to locate our solar and wind power
plants. For this purpose, my job is based mainly on GIS, spatial
analysis, decision making, resource mapping and evaluation, etc.
CONTACTS
Mrs Asmae Azzioui
Masen (The Moroccan Agency for Sustainable Energy)
Zenith Complex, Rabat N° 50, Rocade Sud Rabat-Casablanca A-B Buildings,
Souissi
Rabat, Morocco
Mr Moulay Hafid Bouhamidi
Masen
Mr. Mustapha Mouadine
Masen
Pr. Mohammed Ettarid
Department of Photogrammetry and Cartography, Geomatics and Surveying
Engineering School,
Hassan 2nd Institute of Agronomy and Veterinary Medicine,
Rabat, Morocco.


