Determination of an Appropriate Area for Flood – Water Spreading by Remote Sensed Data and GIS in the Tagharood CaTCHment (Iran)Dr. Gholan Reza ZEHTABIAN, Dr. Seyed Kazem ALAVI PANAH and RAHIN HAMEDPANAH (Iran)Key words: 1. IntroductionFlood mitigation by water spreading on the permeable terrain and artificial recharge of groundwater is necessary in arid areas, because of destructive floods that caused by inappropriate distribution of rainfall and vital importance of ground water resources in this areas. Application of remote sensing and GIS in ground water resources studies and site selection of artificial recharge has been practiced for about three decades. Krishnamurthy et al (1996) demarcated ground water potential zones by remote sensing and GIS. They determined groundwater potential zones by weighting to information layers (including: geology, landform, drainage density, soil types, slope classes, linemeants and water bodies) and controlled chosen areas through well yield data. Saraf et al (1998) determined groundwater potential zones and appropriate areas for artificial recharge by RS and GIS technology through weighting to information layers (including: geology, geomorphology, linemeante and slope classes). 2. The area characteristicsTagharood catchment located between 50º, 2’,28" to 50º ,40’,59" east longitude and 34º,27’,00" to 34º,50’,36" north latitude. This catchement has 127000 ha area. Precipitation and evaporation annual mean of the catchment are 224 mm and 2188 mm, respectively. There are 5 humid month that fitted to cold month of year according to ambrotermic curve. 3. MethodologyThere are four stages during this research: 1. To provide information layers and digitize in GIS environment.1.1 To extract vegetation cover map from satellite data. We used 7 bands Landsat TM data (1991). NDVI image of the study area was extracted after pre-processing operation. Vegetation cover map was provided to determine farming lands boundaries by NDVI image. 1.2 To digitize the other maps to GIS environment. Other thematic maps in this research (including slope classes map, geomorphology map, soil hydrology groups map and modified transver iso - resistivity map) were digitized. 2. To determine site selection criteria and to weight units in every layers.Information layers in different models were weighted according to Krishnamurty et al (1996), Saraf et al (1998) and expert opinion (table 1,2,3)
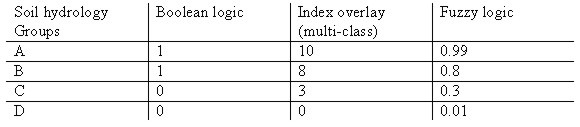
Table 1. Weight of each unit in soil hydrobgy groups map
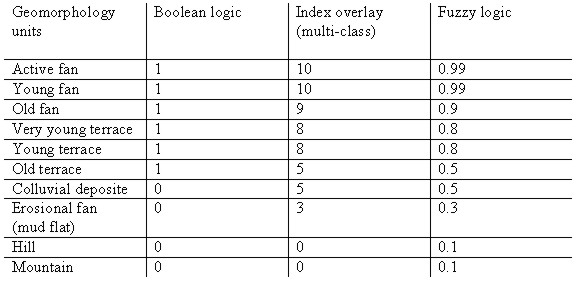
Table 2. Weight of each unit in geomorphology map
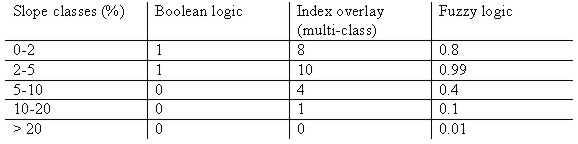
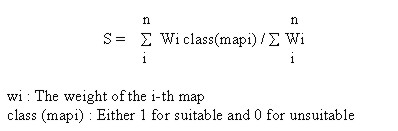
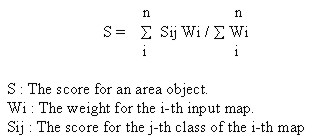
Table 3. Weight of each class of slope map. 3. Combination of information layera and site selection of flood water spreading in each model.3.1 Boolean logic model. In this model weighting of each unit of maps is base on binary logic; 1 (true) or 0 (false). This model have two operators: Boolean OR and Boolean AND. Boolean OR extracts union of sets and Boolean AND extracts intersection of sets. In this research, information layers was combined by Boolean AND operator. After determinating suitable area for floodwater spreading, the output map was crossed with vegetation cover map, then farming lands were eliminated from this map. Ultimately the zone with 8862 ha area was recognized suitable for flood water spreading in this model. In all of the following models, output map classified into five classes (very poor to very good) after layer combination. Then, the output maps were crossed with vegetation cover map and farming lands were eliminated from this map. The characteristics of each model will explain in the consequence sections. 3.2 Index overlay models. Index overlay models allow for a more flexible combination of maps than is possible with Boolean logic combination operation alone. There are two types for this model : 3.2.1. Binary evidence maps The simplest kind of index overlay is where the input maps are binary and each map carries a single weight factor. The result is a value ranging between 0 and 1, which can be classified into appropriate intervals for mapping. At any location, the output score, is defined as :
According to references and expert judgment, weight value 4 for geomorphology and soil hydrology groups maps and weight value 5 for slope map were assigned. In this model a zone with 8862 ha area was recognized suitable for floodwater spreading. 3.3.2. Multi class maps In this model the map classes (units) occuring on each input map are assigned different scores, as well as the maps themselves receiving different weights as before, 3.3. Fuzzy logic model Membership of a fuzzy set, is expressed on a continuous scale from 1 (full membership) to 0 (full non - membership). In this research four operators of fuzzy logic model were used for combination. 3.3.1. This is equivalent to a Boolean AND (logical intersection) operation on classical set values of (1,0).
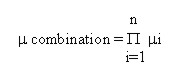
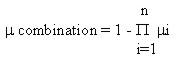
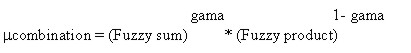
m A is the membership value for map A, and so on. A zone with 4576 ha area was recognized suitable for floodwater spreading in this model. 3.3.2. Fuzzy algebraic product The combined membership function is defined as : m i is the fuzzy membership function for the i-th map. The combined fuzzy membership values tend to be very small with this operator, due to the effect of multiplying several numbers less than 1. A zone with 4576 ha area was recognized suitable for floodwater spreading in this model. 3.3.3. Fuzzy algebraic sum The combined membership function is defined as : The result is always larger (or equal to) the largest contributing fuzzy membership value. A zone with 37137 ha area was recognized suitable for floodwater spreading in this model. 3.3.4. Fuzzy Gama This defined in terms of the fuzzy algebraic product and fuzzy algebraic sum by : gama is a parameter chosen in the range (0,1) , when gama is 1, the combination is the same as the fuzzy algebraic sum, and when gama is 0, the combination equals the fuzzy algebraic product. Output maps in gama operators (0.1-0.9) were classified to five classes and farming lands were eliminated from this maps. 4. Evalution of modelsTwo types of control zones were selected for evaluting of models :
* Transver resistivity = speciefic electrical resistivity ´ alluvium depth. Then each map in models were crossed with control area map, and overlap percentage between suitable area in each model and suitable area in control area map was determined as the criterion of appropriatness of models for site selection in the study area. 4. ConclusionReferences
CONTACTAss. Prof. Gholan Reza Zehtabian Ass. Prof. Seyed Kazem Alavi Panah Ramin Hamedpanah 30 April 2001 This page is maintained by the FIG Office. Last revised on 15-03-16. |