REMOTE SENSING AND GIS TOOLS FOR PLANNING AND MANAGEMENTDr. Seyed Kazem ALAVI PANAH and Gholan Reza ZEHTABIAN, IranKey words: 1. INTRODUCTIONRemotely sensed data and geoinformatics give a revolution in research of agriculture, land, water and marine resources and geomorphology. Remotely sensed data offers the researcher to facilitate the investigations, assessments and they may lead to a more understanding of sustainable development. To reach a sustainable development, the effect of development social, economic, environment and resources will require decision maker to manage the large quantity and various information on environment. Geoinformatic is the key method to achieve sustainable development, and it offers the possibility of more careful evaluation. To use remotely sensed data in the researches and management of sustainable development, at first we should draw out a set of capabilities of remotely sensed data in the study of environment and natural resources. 2. REMOTE SENSING APPLICATIONSRemotely sensed data have been widely used in a wide range of applications including agriculture, land, water and marine resources, geomorphology and desertification: 1. Agriculture: Land cover classification for land resources inventory, crop inventory, forest inventory. Range inventory; Monitoring vegetation cover change; Determination of vegetation stress, land use and crop forecasting; Regional information for census purpose; assessment of grassland fire damage; regional land use; flood production for casting, rainfall mapping, agrometeorology. 2. Land and water resources: Determination of water bodies and surface water inventory; mapping of flood and flood plains; snow pack, fall boundaries; sediment transport; Reservoir development; preliminary surveys of groundwater occurrence; delineation of alluvial aquifers, location of springs, seeps and shallow water table aquifers by the presence of phreatophytes and riparian vegetation, location and identification of recharge centers, wet land surveys; general reconnaissance soil survey; Revision of soil association maps; Evaluation of land resources for regional planning; soil degradation and desertification studies; navigation of ships; sea surface temperature; Determination of location of potential fish ponds. 3. Marine resources: Pack-ice boundaries; coastal shore line changes; mapping of shallow water table areas; determination of turbidity pattern and circulation. 4. Geomorphology: Mapping linear features; determination of regional resources, revising maps; mapping land forms; erosion and deposition, flood warning. 5. Desertification: Desertification is the processes of deterioration in the ecosystem that can be measured by reduced productivity of desirable plants, undesirable change in the biomass, accelerated soil deterioration and increased hazard for human occupancy. Manifestation of desertification includes (Mabbut, 1984) :
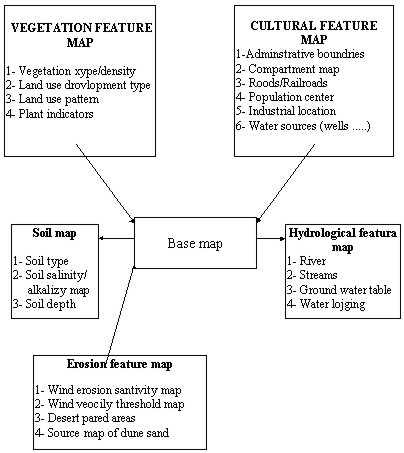
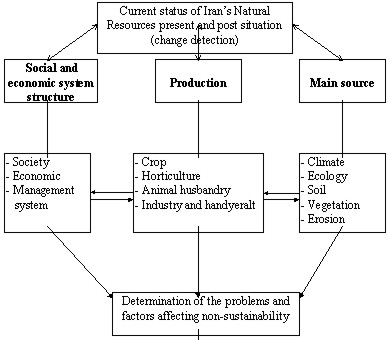
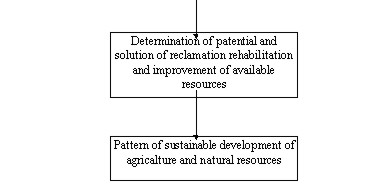
Various forms of soil degradation include salinization, erosion, water logging and chemical degradation of the cultivated lands, about 0.34´10 ha are saline and another 0.56´10 ha are sodic that covers more than 100 countries. Maps and compilations are available for some countries the areas of salt affected land are known only for irrigated region. It has been estimated that saline and alkaline soils cover about 25 million hectares representing 15% of the total land surface and about 30% of the plains and gentle sloping lands one affected by salinity and alkalinity (Dewan and Famouri, 1964). 3. PLAYASPlayas and pans are remarkably insignificant arid zone features is terms of their overall spatial extent, perhaps occupying no more than 1% of arid landscape in total (Mabbutt, 1977). Iran comprises 60 playas (67,250 km) within the interior part that the great Kavir and Lut Desert are the largest (Krinsley, 1970). Seasonal and annual variations of the run-off and underground water table depth are the reasons of the playa change in the short period. Millington et al. (1988) using Landsat data studied the seasonal and annual changes on Chotte el Gouttar, playa. The usual short term playa change is alteration of saline and non saline areas. 4. YARDANGSThe "Yardang" occupy most part of the west part of Lut Desert. Yardang is a Turkman word (Hedin 1903) now used in geomorphology for a wind-abraded ridges of cohesive material (MC Cauley et al., 1980). Although Yardangs are formed only where fluvial action and weathering are slow most have bean initiated from forms created by non-aeolian processes. Many have formed out of gullied terrain (Ward and Greeley, 1984). A number of non-aeolian processes such as salt weathering, desiccation, slumping, piping and rilling are very important in farming Yardangs (Cooke, 1993). Although generally the Yardangs have been formed by wind erosion, an alternative explanation for aligned topography in Lut involves collaborative wind and stream action. Desert have experienced great temporal and spatial variability of these endogenetic process in Iran. 5. MONITORING DESERTIFICATION PROCESSClimatic condition, geographical situation, unfavorable winds and the influence of the Central Desert and Lut-desert combine to effectively render 80% of the country's total area (164 m.ha) arid and semi arid with scanty precipitation ranging from 50 mm to 250 mm annually. Deserts and sand dunes cover 34 m.ha and poor desert range land 16 m.ha in Iran from which 13 m.ha are sand cover desert and about 5 m.ha constitute shifting sand dunes. In some deserts in Iran, ecological changes are occurring rapidly and the reasons are mainly due to a high population urbanization, industrialization and other activities. Sand activity and movement, salinity and waterlogging are of the broad indicators of desertification monitoring. Figure 1 shows the sketch of desert management planning and implementation conceptual GIS. Figure indicates the schematic diagram of studying agricultural natural resources sustainable development.
Figure 1: Desert management planning and implementation conceptual GIS
Figure 2: Schematic diagram of studying agricultural natural resources sustainable development. REFERENCES
CONTACTAssistant Professor Seyed Kazem Alavi Panah Ass. Prof. Gholan Reza Zehtabian 30 April 2001 This page is maintained by the FIG Office. Last revised on 15-03-16. |