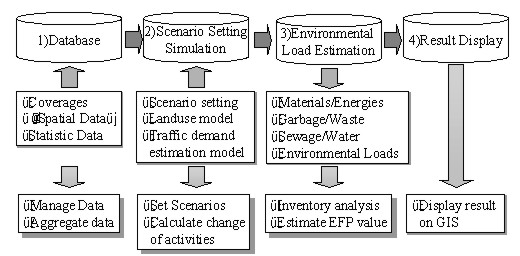
A LIFE CYCLE ESTIMATION SYSTEM OF VARIOUS ENVIRONMENTAL LOADS IN URBAN SPACE RESTRUCTURINGYasuo KITANO, Dr. Hirokazu KATO, and Professor Yoshitsugu HAYASHI, JapanKey words: life cycle assessment (LCA), environmental impact, urban structure, and cohort model. AbstractCities are one of the major sources of environmental loads generated. To find effective measure to reduce the environmental loads from a city, it is necessary at first to estimate the environmental loads, then to evaluate the global and local impacts of the environmental loads. This paper presents a model system to estimate the major environmental loads from a city. The model treats most infrastructures and buildings comprising the study area. Ten kinds of environmental loads are estimated with the method of Life Cycle Assessment (LCA). The estimated values of environmental loads are evaluated by Environmental Friendliness Point (EFP). The model also estimates the environmental impacts of additional buildings and infrastructures. Finally, the effectiveness of the model is clarified by applying various house-building measures and urban spatial structural changes. 1. INTRODUCTIONUrban area has been a place where a lot of materials and energies are used, and enormous garbage and wastes are generated in a trend of mass consumption and disposal. As a result, enormous environmental loads have deteriorated the natural and built environment in local and global scale. In terms of sustainability of mankind and ecological system, it is one of the urgent issues to reduce the environmental loads from cities. There are several proposals for the shapes of the cities that emit less environmental loads. Dantzig (Dantzig et al. 1973) proposes Compact City, which is 8-story 2,650m diameter circle building that can be resided by two million people. Ojima (Ojima et al. 1992) proposes 1,000m height rectangular parallelepiped building and claims that the population and the businesses in Tokyo can be accommodated in several buildings. Town and Country Planning Association (A. Blowers 1993) recommends measures to reduce the environmental loads for each size of the city or region, namely Social City Region. These proposals mainly discuss the amount of environmental loads from the operation of the cities but the environmental loads generated from construction and demolishment of existing facilities in the cities are almost entirely ignored. Considering the fact that the structures and the components of the proposed cities are totally different from the existing cities, changing existing cities dramatically or developing the virgin land, it can be said that it is necessary to estimate the amount of environmental loads considering the process of change of the cities. There is also other problem, which is the existence of the tradeoff between environmental loads. If one environmental load is reduced by a measure, other environmental loads could increase instead. Also normally in terms of the estimation of environmental load, carbon dioxide is mainly focused on with the concern of global warming, but it is also necessary to estimate and evaluate other environmental loads. Considering the problems of existing research conducted, this paper presents a GIS-based simulation system to estimate ten kinds of environmental loads from a city. As a method of the estimation of environmental loads, Life Cycle Assessment (LCA) is applied for each facility. The merit of the introduction of LCA is that it is possible to estimate direct and indirect environmental loads from all stage of the facilities. To evaluate the environmental loads, Environmental Friendliness Point (EPA) is used as an integrated indicator. Also to describe the changing structure of the city, Building Cohort Model is applied. 2. APPLYING LCA TO URBAN SPACE RESTRUCTURING MEASURES2.1 Definition of Life Cycle Environmental Load and Extended Life Cycle Environmental Load
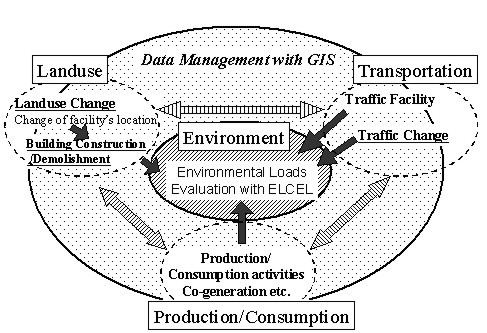
Figure 1. Activities and their relationship Figure 1 shows the overall sources of environmental loads and their relationships with each other. There are three activities, landuse, transportation, and production and consumption. These are related with each other. For example, when landuse changes, the traffic pattern also changes. Then, this change causes the landuse change in the long run. These activities are conducted on the "urban stock", which is composite of facilities that relate to a city such as buildings and infrastructures. Existing researches about Infrastructure LCA (ILCA) have dealt with the Life Cycle Environmental Load (LCEL) from each facility. However, when treating a whole city, not only the urban stock itself generates environmental loads, but also the condition of urban stock changes the activities in a city and this also causes the change of the amount of environmental loads from a city. Kato (Kato 1998) defines the Extended Life Cycle Environmental Load (ELCEL) as environmental loads from urban stock (LCEL) and environmental loads from the activities that relate to a city. In this research, the concept of ELCEL is applied to estimate the environmental loads. 2.2 Existing ResearchThere are several researches estimating the environmental loads from a city or an area. One method is macro approach. This is appropriate to estimate the amount of environmental loads more correctly but it is difficult to test the effect of environmental load reduction measure. On the other hand, summing up approach, which estimates the environmental loads from each facility and activity and then piles up all of them, is appropriate to test the reduction measures. Existing researches estimating the environmental loads by summing up approach from a city or an area are summarized below: 1. HANAKI (Hanaki et al. 1996)
2. MORIOKA (Morioka et al. 1999)
3. KURODA (Kuroda et al. 1999)
2.3 Characteristics of this ResearchConsidering the shortcomings of the existing researches, this research attempts to estimate the environmental loads with the concept of ELCEL. This research has five characteristics listed below:
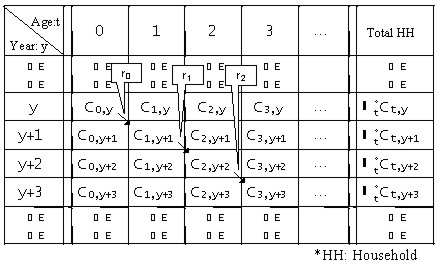
3. BUILDING COHORT MODELTo consider the transition of the structure of the city, by applying Building Cohort Model which is same as the cohort model used in demographic forecast, the estimation of environmental loads in time series can be conducted and several housing and city structure measures are tested. Figure 2 shows the calculation method of building cohort model. By using 1-rt, which represents the demolishment rate of age t (rt represents the survival rate of age t), total number of demolished houses in year y can be described as Σt(1-rt)Ct,y. By inputting the number of new houses exogenously which is represented as C0,y+1, total number of houses in year y+1 can be described as Σt+1Ct+1,y+1.
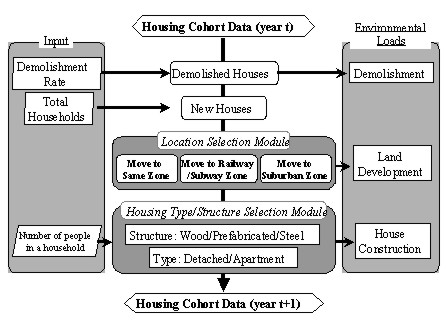
Figure 2. Calculation method and Cohort model Figure 3 shows the structure of model constructed. It is applied to each zone and each type of houses in Nagoya. This model has two modules such as locational selection module, and structure selection and house type selection module. Through these modules, the effects of the measures can be analyzed.
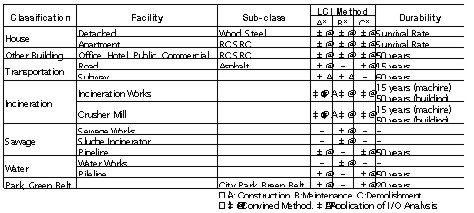
Figure 3. Building Cohort Model The survival rate used is the result of Noshiro (Noshiro 1991). Building data used is Housing Statistics in Nagoya in 1992. The data can be gained in each ward and it is allocated to the 108 zones proportionate to the number of household in each zone. The house type is decided by multi regression analysis (variables: number of people in each household, land price i. e.). As the number of people in each household has tendency of decreasing, the ratio of apartment house increases and then the number of apartment houses increases. In terms of structure type, it also could change, but it is fixed to the ratio that is gained from the Housing Statistics in Nagoya, because of the data limitation. 4. ENVIRONMENTAL LOADS ESTIMATION METHODS AND GIS BASED SIMULATION SYSTEM4.1 Life Cycle Inventory (LCI) Method AppliedTable 1 shows the facilities considered and LCI method applied to each stage. Considering the characteristics of the data, two types of LCI method, Combined Method and Application of Input/Output Analysis, are used. The application of these Methods to the environmental estimation is described below:
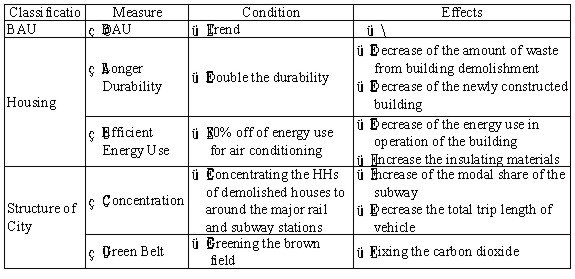
5. MEASURES APPLIEDThe measures applied are listed in Table 2. The start year is 1991 and the final year is 2040. The calculation is conducted in every five years and the calculated values are five year total. BAU (Business As Usual) means that all facilities will change according to the trend change and the characteristics of the traffic such as modal share are constant. Measures for housing (2 and 3) and measures for structure of the city (4 and 5) are not only tested as a single measure, but also are tested to see the effective combination.
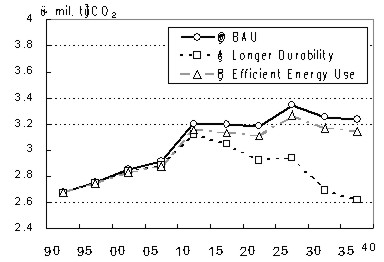
Table 2. Measures to be applied 6. RESULTS6.1 LCEL by the Measures for Housing SectorFigure 5 shows the transitional change of the amount of LC-CO2 of 1.BAU, 2.Longer Durability and 3.Efficient Energy Use from the housing sector.
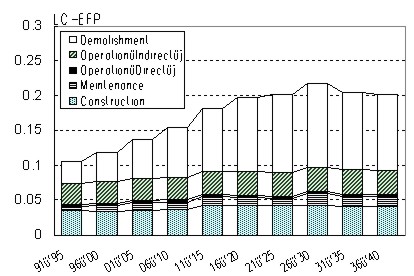
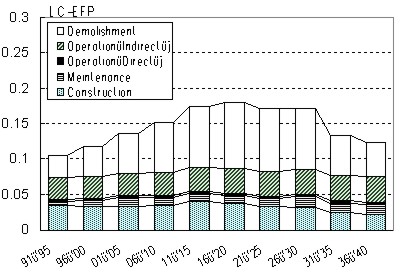
Figure 5. The Amount of CO2 by Housing Measure BAU shows that in the fifty years from 1991-95 to 2036-40 the amount of LC-CO2 increases by 21.0%. Longer Durability Measure shows that until 2010 it increases almost same direction as BAU but after that it goes downward and finally decreases by 2.1% (compared with 1991-95 of BAU) and by 19.1% (compared with 2036-40 of BAU). In terms of Longer Durability measure, the amount of energy use increases by 2.9% (1991-95 BAU) and decreases by 15.4% (2036-40 BAU). The amount of NOx decreases by 6.2% (1991-95 BAU) and decreases by 23.7% (2036-40 BAU). Also the waste from building demolishment increases 51.8% (1991-95 BAU) and decreases by 65.0% (2036-40 BAU). In the long run, Longer Duration measure is efficient to reduce the environmental loads. On the other hand, in terms of Energy Efficient Measure, LC-CO2 increases by 17.6% (1991-95 BAU) and decreases by 2.7% (2036-40 BAU). The share of the energy efficient house increases year by year and in 2036-40 the share of the energy efficient house dominates. But the effectiveness of this measure is slim, because of the additional insulating materials that cause the increase of the environmental loads in construction stage. LC-Energy increases by 16.3% (1991-95 BAU) and decreases by 2.0% (2036-40 BAU). LC-NOx increases by 17.9% (1991-95 BAU) and decreases by 0.5% (2036-40 BAU). These results show that only with the Energy Efficient Measure it is hard to reduce the environmental loads to meet the COP3 criteria. Figure 6 shows the result of the change of EFP from the housing sector from 1991-95 to 2036-40 in BAU. The value of EFP from the construction stage increases gradually. The average floor space of the detached house is about two times larger than that of the apartment house. However, the materials used in the apartment house are mainly steel and concrete. This brings about more environmental loads compared with the Japanese typical wooden detached house. As the share of the detached house decreases and the share of the apartment house increases in 50 years, this causes the increase of the EFP of the construction of houses. The value of EFP of the waste increases dramatically by 300% and the share of the waste in the total value is 54.1% in 2036-40. Evaluating by EFP, the waste turns out to be a major source of environmental loads.
Figure 6. Life Cycle EFP of Housing Sector (BAU) In Figure 7 shows the result of the Longer Durability Measure. In it, as the numbers of the new buildings and the demolished buildings decrease gradually, so the EFP decreases by 28.6% compared with the peak value in the 2016-20. From this result, the Longer Durability Measure is effective to decrease the EFP.
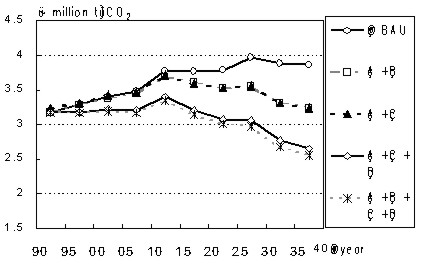
Figure 7. Life Cycle EFP from Housing Sector (Longer Durability Measure) 6.2 LCEL by the Measures for the City StructureFigure 8 shows the transitional change of the LC-CO2 and also Figure 9 shows LC-EFP from the all facilities considered. 4.Concentration Measure is that the households whose houses are demolished move to the zone where there are major railway or subway stations. 5.Green Belt Measure means that the brown fields, which are made by the movement of the households with 4.Concentration Measure, are changed into the green park. The CO2 fixing rate of the green park is set to 30t-C/ha?year (Ichimura 1999). In terms of BAU, LC-CO2 increases by 21.6% in 2036-40 compared with the value in 1991-95. By the combination measure 2+3, LC-CO2 increases until 2015 but after that it goes downward. Finally in 2036-40 it increases by 2.2% (1991-95 BAU) and decreases by 16.0% (2036-40 BAU). In terms of Measure 2+4, the similar change as Measure 2+3 occurs. With the combination measure of 2+4+5, LC-CO2 decreases by 31.5% (BAU in 1991-95). And it decreases by 34.6%, when 3.Energy Efficiency is added. This is because the area of the green belt increases year by year and in 2036-40 the area of the green belt is 91km2, which is about one fourth of the total administration area of Nagoya. This shows the effectiveness of Green Belt Measure when the large green belt is developed.
Figure 8. Life Cycle CO2 Change by Each Measure Set
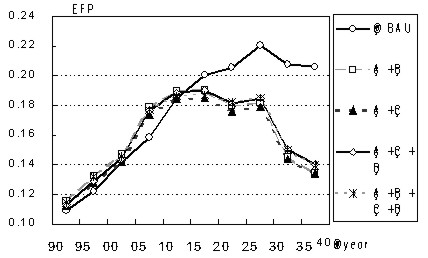
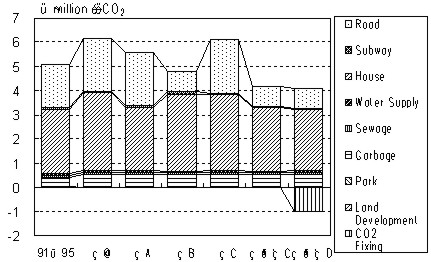
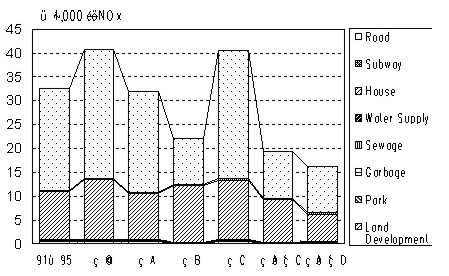
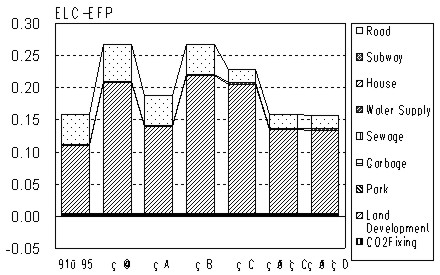
Figure 9. Life Cycle EFP Change by Each Measure Set By BAU, LC-EFP increases by 89.0% in 2036-40 (BAU 1991-95). On the other hand, Measure 2-5 brings about relatively low increase by 21.2%. The reason why the result of the Each Measure set is almost similar is that each Measure set contains 2.Longer Durability, which dominate the value of LC-EFP. 6.3 ELCEL by the Measures for the City StructureFigure 10 to 12 show the Extended Life Cycle (ELC) CO2, NOx and EFP respectively. In terms of ELC-NOx, which causes the air pollution, the vehicle is the major source. In terms of ELC-EFP, housing sector is the major source. When applying the combination measure, 2 to 5, it can reduce ELC-CO2 by 39.1%, ECL-NOx by 51.9%, and ELC-EFP by 1.1% (BAU 1991-95). Also this measure reduces ELC-CO2by 49.8%, ECL-NOx by 61.4%, and ELC-EFP by 41.5% compared with the BAU in 2036-40. From these results, it can be said that the majorities of ELCEL are vehicle and housing sector oriented and other sectors such as rail and sewage dominate little. To reduce the amount of ELCEL, it can be said that the measures for housing sector and landuse arrangement (concentration) is effective.
Figure 10. Extended Life Cycle CO2 by Each Measure Set in 2036-40
Figure 11. Extended Life Cycle NOx by Each MEasure Set in 2036-40
Figure 12. Extended Life Cycle EFP by Each Measure Set in 2036-40 7. CONCLUSIONIn this research, a model system, which can evaluate the environmental loads from the implementation of the long-term city structure change, is developed. Zonal analysis is conducted to take accordance with the land use and traffic simulation models. Applying the building cohort model, the long-term renewal process of the housing location is described. As the model system is developed on the GIS with GUI, it is possible to handle lots of special and non-spatial data easily. Furthermore, ten kinds of environmental loads are estimated and evaluation of the environmental loads is conducted by EFP. The knowledge gained from this study is summarized as:
8. THE FUTUREIn this research, co-generation system and district heating/cooling system whose introduction could contribute less emission are not considered. Heat-island effect, which would be changed by the land use change and affect the energy use, is not considered. Considering them, the effective measures to reduce the environmental loads will be sought. And the environmental loads from commercial and industrial sector will be considered. REFERENCESBlowers A, 1993: Planning for a Sustainable Environment; A Report by the Town and Country Planning Association pp150-189, Earthscan Dantzig G B et al., 1973: Compact City, A Plan for Livable Urban Environment, W.H. Freeman and Company Hanaki K et al., 1996: Reduction of Carbon Dioxide Emission from Construction of NEW TOWNS, Environmental Systems Research vol.24 pp250-271, Committee of Environmental Systems, Japan Society of Civil Engineers Ichimura K et al., November 1999: A Study of Atmospheric CO2 Storage by Trees in Urban Parks, Papers on City Planning, City Planning Review Special Issue pp1-6, The City Planning Institute of Japan Kato H, 1998: Life Cycle Assessment as a Environmental Impact Estimation Method for Transportation Planning, Traffic Engineering Vol.33 No.3 pp81-86, Japan Society of Traffic Engineers Kato H et al. 2000: A LCA-Based Evaluation Model of Change in Environmental Load due to Improvement of Transport Systems, Proceedings of 28th Annual Meeting Environmental Systems Research pp131-138, Committee of Environmental Systems, Japan Society of Civil Engineers Kuroda K et al. October 1999: A Synthetic and Quantitive Evaluation of Policies to Reduce Carbon Dioxide Emission in Urban Area, Proceedings of The Infrastructure Planning Committee, No.22 (1) pp655-666, Japan Society of Civil Engineers Morioka T et al. 1999: Urban Environmental Management based upon Life Cycle Estimation of CO2 from Central Urban Districts, Environmental Systems Research vol.27 pp355-364, Committee of Environmental Systems, Japan Society of Civil Engineers Ojima T et al, 1992: Global Environmental Impact from Building Sector Eco City, The City Planning Institute of Japan Statistics of Construction, 1997: Ministry of Construction Department of Construction Economics, Construction Research Institute Tsurumaki M et al.1999: Study on the Calculation Method of Many Kind of Environmental Load for Life Cycle Assessment, Environmental Systems Research vol.25 pp217-226, Committee of Environmental Systems, Japan Society of Civil Engineers BIOGRAPHICAL NOTEYasuo Kitano was born in 1973 and graduated from Department of Town and Regional Planning, University of Sheffield, UK (Diploma programme) in 1999 and Department of Geotechnical and Environmental Engineering, University of Nagoya, Japan (Master programme) in 2000. He is currently working in Geographic Information Department, Tamano Consultants Co. Ltd as a Geographic Information System designer for the local authorities. Tamano Consultants Co. Ltd. is one of the major consulting companies for land use planning and civil engineering field in Japan. His current interest is Strategic Environmental Assessment (SEA) for land use planning and GIS based supporting system for it. For this study he has researched with Prof. Y. Hayashi and Dr. H. Kato of University of Nagoya. CONTACTYasuo Kitano, B.A., Dipl. of Town and Regional Planning, and M.
Eng. 25 April 2001 This page is maintained by the FIG Office. Last revised on 15-03-16. |