Article of the Month -
May 2008
|
Pictometry: Potentials for Land Administration
Dr. Mathias LEMMENS, Christiaan LEMMEN and Martin
WUBBE, the Netherlands
 This article in .pdf-format
(12 pages and 368 kB)
This article in .pdf-format
(12 pages and 368 kB)
1) This paper was originally
prepared for and presented at the 6th FIG Regional Conference in San
José, Costa Rica 12-15 November 2007.
Key words: Pictometry, oblique images, photogrammetry,
cadastre and land registration, topographic mapping.
SUMMARY
The Netherlands' Cadastre, Land Registry and Mapping Agency
(Kadaster) performed a research to the potentials of the Pictometry
technology for cadastral purposes in close co-operation with the GeoTexs
company from Delft, The Netherlands and Blom Info, Copenhagen, Denmark,
part of the Blom Group. Blom Group has an exclusive license to apply
Pictometry technology in Europe. Data capturing with this technology
will be executed for all 50.000+ inhabitants cities in Europe. The
patented technology allows users to easily and efficiently view and
measure in ortho images and oblique images and enables creation of a
much richer database of the real world while the images can be processed
in existing GIS environments. In the research Pictometry images were
used captured in 2006 and covering the entire territory of Apeldoorn
municipality, The Netherlands. The map data consists of: (1) boundary
lines of objects of Top10Vector and Top25 Raster, (2) feature lines of
the Large Scale Base Map of the Netherlands (GBKN) and (3) cadastral
map. Our tests reveal that the accuracy of taking location measurements
in ortho-images is 19cm and in ortho-images 86cm, expressed in terms of
root mean square error. The accuracy of the elevation component depends
on the accuracy of the underlying DEM. Although Pictometry technology
has been announced as a visualisation tool, not as a surveying tool, the
above measures demonstrate that photogrammetric surveying accuracy can
be achieved. Within a cadastral context Pictometry may serve as aid in
splitting parcels and carry out parcel formation. Furthermore, it
appears to be a suitable tool for (1) preliminary boundary determination
via notary, (2) building registration and (3) communication from
government to citizen.
1. INTRODUCTION
Pictometry is an aerial image acquisition and data processing
technology developed and patented by US-based Pictometry International
Corp, headquartered in Rochester, New York. The essential difference
with conventional airborne photogrammetry is that in addition to
vertical also oblique images are taken, which is enabled by a sensor
system consisting of five cameras, one directed nadir (image plane
approximately parallel to terrain), the others viewing forward,
backward, left and right (Figure 1). The viewing angle for all sideward
looking cameras is approximately 40 degrees off-nadir (Figure 2). The
(mutual) geometry of the five cameras is accurately calibrated,
potentially providing, in conjunction with today’s advanced computer
technology many new application prospects. The dynamic range of the grey
values is 12 bits enabling to carry out surveys under unfavourable light
conditions. The present standard approach stems from US homeland
security purposes and includes a flying height for neighbouring images
of 3,000 feet (1,000m) and for community images 6,000 feet (2,000m) and
pixel size 6 inches (15cm) and 1 foot (30cm), respectively. In oblique
images the pixel size varies from 10cm at the bottom to 18cm at the top
of the image. The standard products acquired by Blom Group of Europe are
usually neighbourhood images. Up to 16 square kilometre can be acquired
per hour and every 1.5 seconds photos are taken. Each image consists of
6MB of data while each square kilometre is covered by around 50 views,
that is around 310mb of data. Each point on the ground is visible in up
to 18 oblique images, provided absence of occlusion (point is not
visible because it is concealed by another object in the line of view).
Direct geo-referencing is enabled through the onboard, integrated GPS
and Inertial Navigations Systems (Applanix, a subsidiary of Trimble).
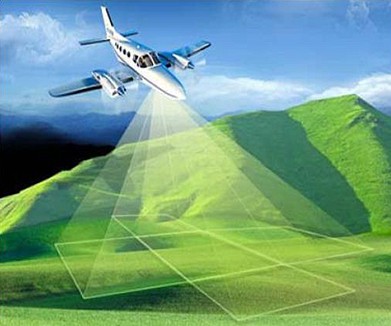
Figure 1. The Pictometry camera sensor systems consists of five
cameras, one directed nadir, the others viewing forward, backward, left
and right (Image Courtesy: Blom Group).
In the standard approach, vertical images have a 30% along track
overlap. This is sufficient to ensure that no gaps occur due to
unplanned movements of the airplane but not enough to allow
stereo-viewing and mapping. As from October 2006 onwards, Blom Group has
modified the standard approach to 60% along track overlap, which allows
for stereo viewing. To create orthoimages from non-stereo vertical views
a Digital Elevation Model (DEM) is required. In the Netherlands the
existing AHN (Actuele Hoogtebestand Nederland) is used. In the case of
stereo-images, DEMs can be semi-automatically extracted from the
overlapping images, using image matching techniques. Pictometry images
are provided as an integrated library to be used with the Electronic
Field Study (EFS), which is software to view and measure both ortho and
oblique images and to navigate and find a required location.
The ongoing Pictometry project, currently the largest
image-acquisition project in Europe, aims at creating a standard
database of oblique and ortho-aerial imagery covering every town in
Europe with more than 50,000 inhabitants, a total of over nine hundred
towns, the first and main customer is Microsoft. By the end of September
tens of cities in the Netherlands are already available (http://maps.live.com;
http://local.live.com). An
interesting feature of the business model is that, anticipating growing
interest in geo-information on the part of non-conventional users and
partly induced by the success of Google Earth, Blom first acquires the
images and then approaches potential customers. Anyone can then take out
a licence to use the standard image library for a price per square
kilometre. The standard list price is presently Euro 250/km2 annually
but depends on, amongst others, volume ordered and time span of
subscription. Image acquisition without ordering at forehand is a
business model gaining popularity; for example, Cyclomedia, which
captures terrestrial photographs from a car platform, has also adopted
this capture-prior-to-order model. And of course, this model already
exists for decades for Earth observation from satellites.
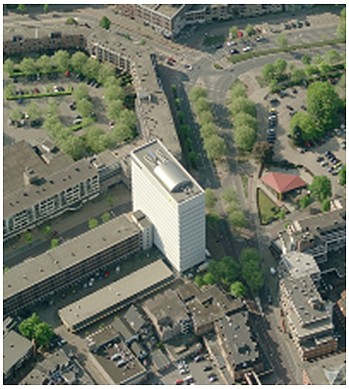
Figure 2. Oblique view from the North on main building of
Kadaster in Apeldoorn.
Cadastral Applications in Europe
Although a recent technology, Pictometry has already attracted the
attention of several cadastral institutes in Europe. The Spanish
cadastre has started a project in which they use Pictometry ortho images
for detecting illegal buildings along the Mediterranean coast as an aid
to monitoring urban growth. Spain has a good mapping record: 40% of
urban areas are on scale 1:1,000. No use is made of a standard product,
but the images are acquired in dedicated surveys. The ortho images have
a Ground Sampling Distance (GSD) of 10cm. Also the Danish Cadastre (KMS)
has shown interest in Pictometry. IGN France and Ordnance Survey in
England are resellers of the product.
Aim of the Research
The research aimed at investigating whether and if yes, how, Kadaster
might benefit from the Pictometry technology within the framework of its
ambitions and vision on the future. The following questions have been
addressed:
- Achievable accuracy
- Information content
- Addition of geo-referenced oblique images to conventional
airborne photogrammetry
- Possibilities to support the definition of preliminary cadastral
boundaries and measuring newly created cadastral boundaries
- Costs
2. CHARACTERISTICS OF PICTOMETRY
One may ask what does Pictometry technology add to traditional aerial
photogrammetry? In principle just oblique images are added, and there is
nothing new about that. In the past the process of extracting accurate
geometric information from aerial images was restricted technologically
and could only be done on a production scale by using vertical images.
Much emphasis was on using vertical images measuring stereoscopically
and the whole image acquisition and measuring process was adapted to
this. Compared to carry out measurements in mono nadir images, measuring
in stereo images brings the following advantages: (1) acquisition of 3D
coordinates without support of a Digital Elevation Model, (2) better
interpretation, (3) higher precision is achievable because points can be
better identified. Today the geometry of the sensors can be calibrated
accurately, direct geo-referencing can be done through GPS and inertial
navigation systems while complex geometric transformations can be
carried by computer and additional information sources, in particular
high resolution, accurate DEMs, can be easily incorporated by
computational means. As a result, extraction of relatively accurate
geometric information from oblique images is now possible. The biggest
advantage of oblique images compared to vertical images is better and
more intuitive interpretation. Interpretation of vertical images
requires training and craftsmanship while the interpretation and taking
measurements in oblique images can be done after a short training. This
statement has been confirmed in our tests. Oblique images make aerial
information thus accessible to a large, non-professional user group,
such as officers at municipalities to support their actual tasks.
Measurements which can be carried out on the oblique images include
height, distance, area, location and elevation. Volume of, for example,
buildings although in principle possible, can not yet be determined by
the EFS software. Both the ability to observe the environment from an
oblique viewpoint and the ability to take measurements provides many new
applications for a variety of user groups. Table 1 provides a
non-limited list of possible applications within the context of
Kadaster.
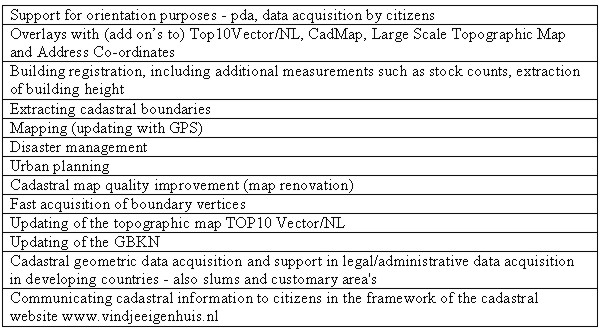
Table 1. Possible applications of
Pictometry
Pictometry versus Microsoft’s
local.live.com
What does a license for using Pictometry products, which is rather
expensive, add to using the same images available at Microsoft’s
local.live.com website for free? Actually, the two scenarios are not
comparable at all. First of all, the availability of images and areas
are completely determined by Microsoft; images may be available but not
yet included on the website. Furthermore, and more importantly only the
oblique images are available, not the ortho-images with as consequence
that no stereo-images will be available. Another major drawback is that
users are not enabled to carry out measures on the images and to use
them as a navigation tool for example to access other data sets. In
short: Microsoft’s website local.live.com enables just viewing of weakly
geo-referenced oblique images.
3. TESTING AND RESULTS
A laboratory environment was created, including a stand along
computer on which all data and the pictometry software (EFS) was
installed. Furthermore, two regular computers with internet connection
were available. In addition to Pictometry images of Apeldoorn digital
maps were installed on the stand alone computer; all maps were
transformed to WGS84. All map data contained geometry of objects; the
attribute data were removed to ease testing. The map data included:
- Boundary lines of objects of Top10Vector and Top25Raster
- Feature lines of the Large Scale Base Map of the Netherlands
(GBKN)
- Cadastral map.
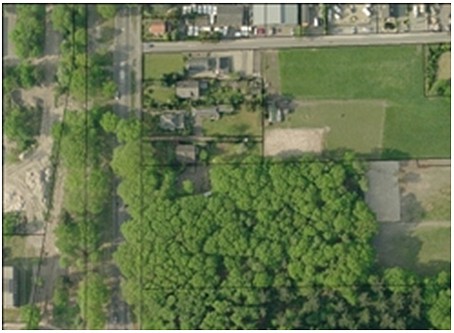
Figure 3. Cadastral map (black lines) superimposed on Pictometry
ortho-image.
Accuracy Assessment
To answer research question 1 (estimation of the accuracy) a
comprehensive test was conducted by creating a test field of single
points around the Kadaster building of which the x,y coordinates were
determined by high-end GPS measurements. Well-identifiable points in
particular corners of white roads signs which contrast much with the
dark colour of the street asphalt were selected. As a measure of
accuracy the root mean square error (RMSE) of the x and y coordinates
were determined (Table 1).
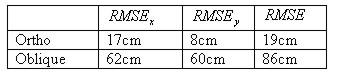
Table 1. Accuracy assessment of Ortho-
and Oblique images.
To determine the variability of measuring in different oblique
images, all GPS points visible in all oblique images were measured; one
to six measurements of the same point were carried out, depending on the
visibility and identifiably of the points in the diverse oblique images.
For 31 points two or more measurements could be carried out; the average
values and other statistics are shown in Table 2.
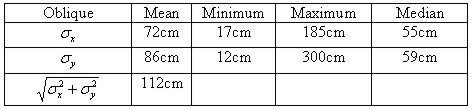
Table 2, Statistics of measuring
identical points in different oblique images.
The achievable accuracy of the elevation component (elevation;
research question 2) depends on the accuracy of the underlying DEM.
Information Content
Are Pictometry images suited as an aid for updating large scale
topographic maps? An experienced operator was invited to work for two
days with the Pictometry technology. He received the explicit tasks to
confront the information contents and functionality of Pictometry
technology with the work procedures he was used to update topographic
maps at TD Kadaster, the following advantages were found:
- With 15cm GSD the resolution of pictometry images is more than
twice as high as the images used by TD (36cm), the better sharpness
improves interpretation
- Oblique images enable to look “underneath” objects which
improves the quality of attribute assignment (Figures 4)
- The height measuring tool improves attribute assignment
- Operating EFS software is easy and intuitive
- Having available the topographic map on screen improves the work
process because of the better orientation capability
- Colour information adds value during attribute assignment
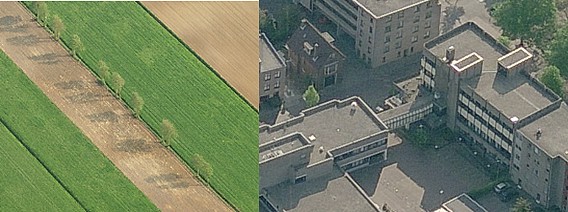
Figure 4. Left, Oblique image enables to recognize that the trees
are located at the left side of the ditch. Right, Oblique image showing
a corridor connecting two buildings, hanging free in space.
Shortcomings are related to viewing images in mono-mode and include:
- Reconstruction of the footprint of buildings is very difficult;
only the edges of roofs are visible. In some practical situations
the footprint and “roofprint” are different
- Discontinuities are difficult to recognize in mono-images,
although an impression of height differences can be obtained by
using several oblique images, but this is time-consuming
- In general mono images lose an important visual clue (depth)
compared to stereo images. Absence of the stereo component is, as
earlier stated, not a characteristic of the Pictometry technology
itself, but of the standard products delivered.
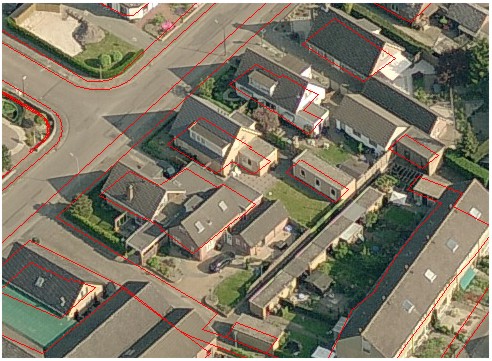
Figure 5. Projection of GBKN lines into oblique image.
The functionality of the EFS software is compared to digital
photogrammetric workstation software rather modest:
- No possibility to extract polygons, an important feature for
topographic map updating
- When switching from the one oblique image to the other often
requires scrolling to get the concerning object in centric screen
view; this is time consuming and labour intensive
- The ability to project the digital topographic map into oblique
images is in general not of much use because the correspondence
between both may be weak as a result of occlusion of the ground area
by mainly buildings, which leads to a confusing view (Figure 5)
- Direct mapping of features and their attributes on colour images
is not feasible, because attributes are assigned to features in the
form of colour codes which are difficult to observe on colour
images. Furthermore, black/white images do have a better contrast.
Parts of the above shortcomings in functionality may be resolved by
plugging EFS into GIS packages such as Geomedia and ArcGIS, for which
plug-ins have been developed. Such plugs-in were not used in our tests.
GBKN Use
In the GBKN context, Pictometry technology could be used for:
- Checking, editing and completion of the automated created
polygons in the process to enhance the GBKN from a line-oriented
data base to an area-oriented database. This can be done manually by
superimposing the GBKN on the ortho-images, while keeping the
oblique images at hand in the form of thumbnails as an additional
interpretation aid
- As source to add manually object codes to the polygons
- As an additional information for the surveyor while being in the
terrain for retrieving the location of pipelines, sewerages,
telephone line and other utilities. Using the ortho images as a
backdrop, the GBKN and the utility map can be superimposed on the
images. Since the different data sets can be merged with high
accuracy, measures can be derived such as the distance from a road
edge visible on the ortho image and an utility line element visible
in the map.
Cadastral Use
When a party buys a part of an existing cadastral parcel, the parcel
has to be split into two entities and the boundary between these
entities measured. How can Pictometry technology support this process?
After signing the transaction act at the notary, the splitting of
parcels is usually down in two stages. First the buyer and seller carry
out boundary addressing in the presence of a cadastral land surveyor.
Next the surveyor measures the boundary in the terrain. Sometimes both
actions are carried out simultaneously; immediately after boundary
addressing the surveyor measures the boundary, but there might also be a
(large) time delay between both. Furthermore, boundary addressing is
usually not carried out immediately after signing of the transaction act
at the notary, there is a time delay which may appear too long for some
parties. Therefore, these parties will carry out boundary splitting
prior to going to the notary. In 2006 the cadastre processed 85,000
transaction acts in which a part of a parcel was delivered to a buyer,
thus requiring parcel splitting; 25,000 of these were split prior to
establishing the notary act; that means about 30% of splitting is
subject to prior land surveying of the boundary. The situation in The
Netherlands is quite exceptional. In the most countries splitting of the
parcel has to take place before the transaction act.
The measurement and registration of cadastral boundaries serves two
tasks
- to enable splitting so that new parcels can be created and
registered in the archives of Kadaster. Not only the measurement
values are stored but the new boundary is also drawn on the
cadastral map which serves as an index entry to the registers
- Reconstruction of the boundaries between properties sufficiently
accurate, sufficient often meaning in practice at the centimetre
level. Given the accuracy level determined within the accuracy tests
described above, Pictometry technology will be unable to serve that
aim.
Although Pictometry technology is not suited for the last task, it
may serve the first task as an aid in splitting parcels and parcel
formation by preliminary boundary determination. The reason for prior
splitting is usually not to arrive at an accurate boundary description,
but to establish the new parcels immediately after passing the notary
act. So, the time delay between passing of the transaction act and
parcel formation is crucial because it is often undesirable.
Furthermore, the separation of boundary addressing and actual boundary
measurement is experienced by many as annoying. Given the above
practices it would be beneficial when a system would be at hand which
enables to carry out boundary addressing and subsequent parcel formation
directly at the notary during and as an integral part of the transaction
ceremony. Our tests demonstrate that such a procedure could be based on
Pictometry technology (Figure 6).
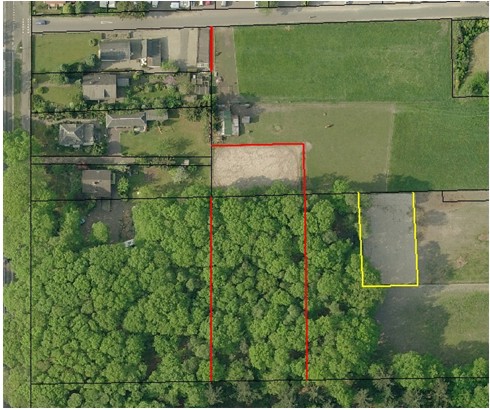
Figure 6. Identification of preliminary boundaries (red and
yellow) in Pictometry ortho-image.
3. COST CONSIDERATIONS
The cost considerations are of a general nature, because the research
did not intend to incorporate Pictometry technology as a replacement in
an existing production process. Suppose for comparison purposes that the
whole of the Netherlands would be flown once in every two years, which
is presently the standard schedule for updating TOP10 by TD Kadaster and
that the standard list price has to be paid to acquire the images: 250
euro per square kilometre per annum. The land area of the Netherlands is
around 35,000 square kilometres. So, the entire territory of the
Netherlands can be captured for a cost of Euro 8.75 million per annum.
When we restrict cost calculations to the major cities (50,000+
inhabitants), which is the present standard approach, just 4,300 square
kilometres have to be captured resulting in a total investment of around
Euro 1 Million per annum.
The Topographic Survey out-sources the aerial surveys necessary to
capture the entire territory of the Netherlands by photographs for
Topographic Map updating. The costs are around Euro one million for
capturing the whole territory of the Netherlands at a resolution which
is, more than two times less than Pictometry images (36cm versus 15cm),
while the flying height is three times less (3km versus 1km). For that
amount the Topographic survey receives stereo film images (black/white
or colour) at scale 1:18,000 which are scanned with a GSD of 36cm. In
recent contracts the images may also be acquired directly in digital
format in colour with a GSD of 27cm.
4. CONCLUSIONS & RECOMMENDATIONS
Pictometry technology is a very promising technology when viewed from
the broader perspective of the ambitions of Kadaster. The costs of
Pictometry technology for covering the urban areas in the Netherlands
(50,000+ inhabitants) is Euro 1Million on an annual basis. As a result
Pictometry technology can be beneficially and cost-effectively applied
when it serves several (future) tasks of Kadaster and in a broader
perspective the geo-information needs of the whole of the Netherlands.
More importantly, Pictometry technology might serve as an engine and
catalyser to fulfil the ambitions of Kadaster to become the principal
supplier of real estate and geo-information within the Netherlands. The
opportunities offered by this emerging technology should be particularly
valued from that perspective.
A better understanding of all possibilities and opportunities of
Pictometry technology in the context of the present and future tasks of
Kadaster, requires further study. From the list of many possible
applications, the Board of Kadaster has selected three pilot studies:
- Identifying preliminary boundaries via notary
- Building registration
- Communication citizens and government
They have been chosen because they are new or rather new for
Kadaster, while they fit within the ambitions of Kadaster and have a
high degree of actuality. The anticipated results of the first pilot
are: (1) better spatial orientation for all parties during transaction,
including buyer, seller and notary, (2) in many cases – say 50% - no
identification in the field will be required anymore, releasing buyer,
seller and surveyor, (3) the splitting and creation of the new parcels
can be realized immediately after passing of the act, (4), the cadastral
map and graphical indication of the new boundary superimposed on the
Pictometry image forms a new template for the surveyor, which can be
used prior to and during measurement in the terrain, and (5) an overview
of cost savings to be gained. The anticipated results of the second
pilot – building registration – include: (1) understanding of the
information required in the building register, (2) insight in which of
the required information can be extracted from Pictometry technology,
(3) development of a prototype to use Pictometry technology as a
navigation tool to access other (geo-spatial) databases, (4) definition
of the concerning work processes and (5) an overview of the costs
involved. The anticipated results of the third pilot include: (1) easier
access to data, such as BAG and WOZ data, over the internet, (2) level
of appreciation by customers, (3) overview of potential products to be
delivered over the internet and applications.
REFERENCES
Lemmens, Mathias, Lemmen, Christiaan and Wubbe, Martin, 2007,
‘Possibilities of Pictometry Technology within Kadaster (Dutch
Cadastre)’, Internal report, The Netherlands' Cadastre, Land Registry
and Mapping Agency
BIOGRAPHICAL NOTES
Mathias Lemmens. Dr. Mathias Lemmens holds a post at Delft
University of Technology, The Netherlands and operates, being principal
of the firm GeoTexs, as an international consultant and technical
advisor specially focused on emerging and developing countries and
specialised in the fields of remote sensing, photogrammetry, Lidar and
GIS. Geodesist by training, he has over twenty-five year's research,
lecturing and advisory experience. He has published over 300 articles
and a state-of-the-art book on Geoinformation Technology. He also serves
as editor-in-chief of GIM International.
Christiaan Lemmen, geodesist, graduated at the Delft
university of technology. He spent the 25 years before joining Kadaster
International in 2002 in information system design and development for
cadastral mapping, topographic mapping and land development. He is part
time associate professor at the International Institute of
Geoinformation Science and Earth Observation (ITC). Within FIG he holds
the position of chairman of a working group on pro poor land management.
He is a contributing editor of GIM International.
Martin Wubbe is within Kadaster International responsible for
the region Central and Latin America. He is a Delft-university graduated
geodesist who has about 25 years experience in managing substantial
projects for cadastral mapping, topographic mapping and land
development. He spent quite some years as project manager in the
America's. The last ten years, before joining Kadaster International in
2004 as a full staff member, he was responsible for land development
projects in the whole western part of the country.
CONTACTS
Mathias Lemmens
Delft University of Technology and GeoTexs Delft
Section GIS-technology
Jaffalaan 9, 2628 BX Delft
THE NETHERLANDS
P.O. Box 5030, 2600 GA Delft, NL
Tel. +31 15 2781042
Fax: +31 15 2782745
Email:
M.J.P.M.Lemmens@tudelft.nl
Christiaan Lemmen
International Institute for Geo-Information Sciences and Earth
Observation (ITC)
Hengelosestraat 99
7514 AE Enschede
THE NETHERLANDS
Tel. + 31 53 4874523
Fax + 31 53 4874575
Email:
chrit.lemmen@kadaster.nl
Web site: www.itc.nl
Martin Wubbe and Christiaan Lemmen
The Netherlands' Cadastre, Land Registry and Mapping Agency (Kadaster)
P.O. Box 9046
7300 GH Apeldoorn
THE NETHERLANDS
Tel. + 31 881833110
Fax + 31 553557362
Email:
Martin.Wubbe@kadaster.nl
Chrit.Lemmen@kadaster.nl
Web site: www.kadaster.nl
 |
